1.) The long-term (5 year) trend is still intact for the SPY and QQQQs. However, the IWM's (Russell 2000) are in a technically precarious position. They are trading right at long-term (multi-year) year support. Assuming the Russell 2000 is a proxy for risk appetite this should cause concern because it indicates traders are moving away from riskier areas of the market. Also see this post regarding the Russell possibly breaking through support in a consolidation triangle.
2.) I've advanced the theory that the SPYs have printed a double top this year, with those double tops occurring at the same level as previous highs nine years ago. In addition, the SPYs are seriously beginning to look like they are in a bearish pattern of lower highs and lower lows. Considering the general economic backdrop of the US economy right now, further continuation of the lower high/lower low seem far more likely.
3.) Last week's 5-minute chart shows three consecutively bad days, with a high-volume sell-off at the end of trading on Friday.
4.) The transports have broken technical support.
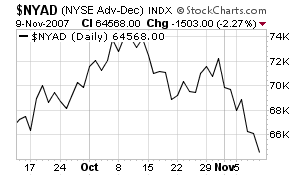
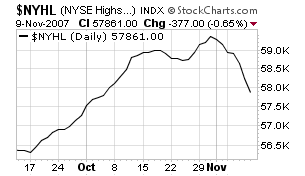
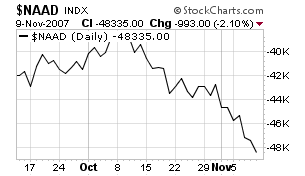
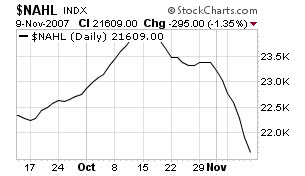
Market breadth is negative across the board.
NYSE advance/decline
NYSE new highs/new lows
NASDAQ advance/decline
NASDAQ new highs/new lows
Now -- reference the NASDAQ advance/decline chart from above. A declining advance/decline line means fewer and fewer stocks are participating in the rally. Last week, we saw some of the market's high fliers break trend as well.
Apple
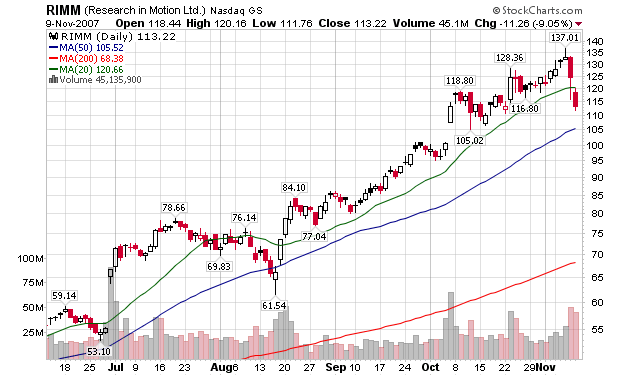
Research In Motion
Intuitive Surgical
Bidu
Dry Ships
Amazon
Intel
New Oriental Education

In other words, the fewer and fewer stocks that were leading the markets higher took hits last week. Considering some traders probably have big profits in these stocks, they may want to book those profits in the face of market weakness.
The SPYs and QQQQs look terrible.
The SPYs are now below the 200 day simple moving average. Last week they sold-off on heavy volume.
The QQQQs - the market darlings for the last few months -- have broken their uptrend. They broke through three SMAs last week on heavy volume.
The bottom line is the technical picture is terrible at best.
1.) We had three days of negative trading ending in a high-volume sell-off,
2.) The SPYs are below their 200 day SMA,
3.) The QQQQs broke their uptrend,
4.) Breadth is negative across the board, and
5.) The market's fewer and fewer strong stocks all took hits last week that broke their uptrends.
6.) There is also the further complication of the CDO/mortgage issue. It's quite possible that before the week is over we'll see more write-down of mortgage portfolios.
On top of that, there is little technical reason for the markets to rally, except, "the markets have sold off so we should nibble at some shares," or in practical parlance, "the technical bounce".
This is not the week to go long on anything. In addition, I would not be surprised to see a further sell-off.
There are four saving graces this week.
1 and 2. PPI and CPI are released this week. I would expect the markets to rally on a good (low) number because that would indicate the Fed has room to lower rates. (Conversely, a spike in either of these numbers could lead to a sell-off because it would lower the possibility of a rate cut.)
3. On the good side (referencing the long-term charts), the SPYs could fall another approximately 5.5% and still maintain their long-term rally. With the QQQQs, that number is 5.6%. That margin gives traders a lot of leeway in making trading decisions.
4. The ever classic random event that no one can plan for.