Also a note about my charts. I'm playing with different chart formats. After reading Tim Knight's blog Slope of Hope I'm trying out a longer chart using log scale. I'm not sure if I will continue to use it, but it does seem to show price movements in a clearer way.

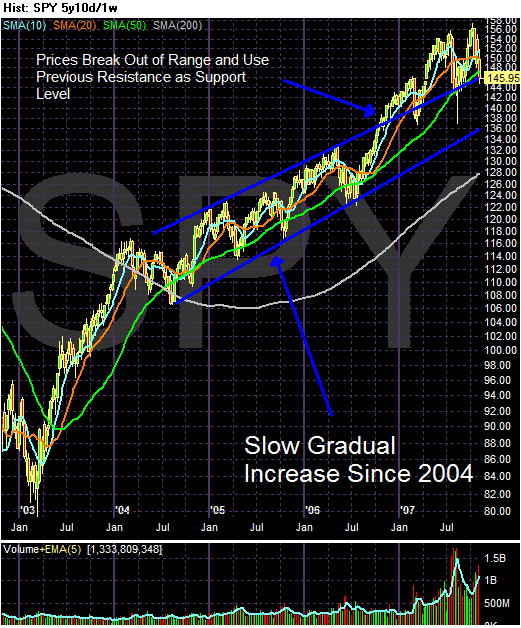
The SPYs were in a three year uptrend which they broke out of in late 2006. They have rallied from previous resistance levels twice. There are two ways to look at the two tops formed in 2007. One is as part of an increasing highs/increasing lows rallying formation. The other is as a double top. The highs are within two points of each other, so a double top seems the more likely explanation; the second top isn't meaningfully higher than the first.

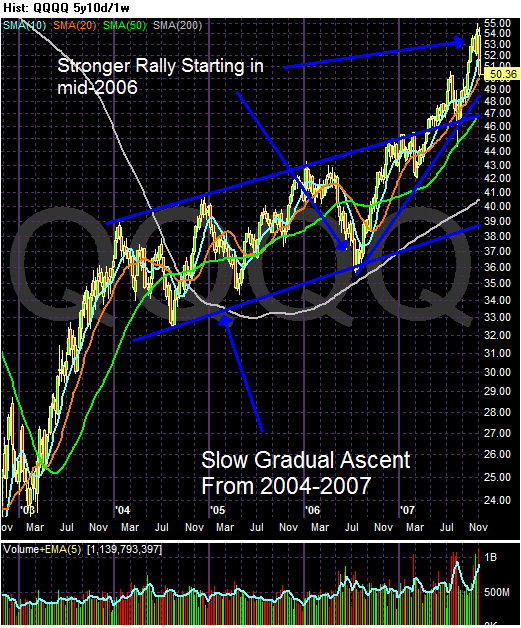
Like the SPYs, the QQQQs were in the middle of a three year uptrend starting in 2004. However, starting in mid-2006, the QQQQs went into another pattern -- an upward sloping rally. They are still in the middle of this rally; in fact, the QQQQs have two levels of long-term support. The first is the upper range of the 2004-2007 rally. The second is the support of the upward sloping rally that started in 2006.

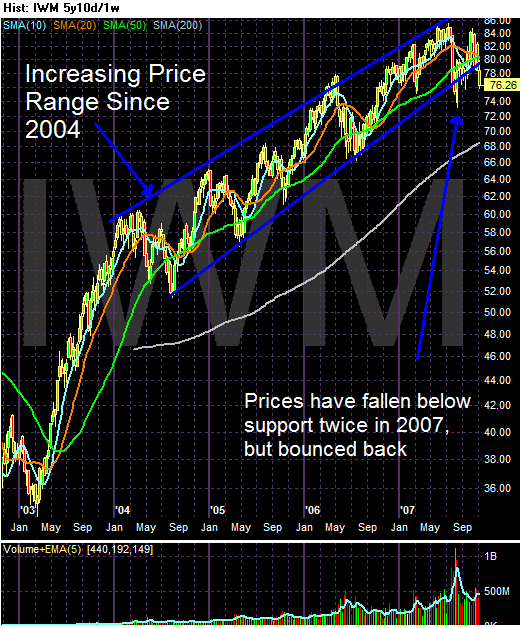
The Russel 2000 is at the lower end of a four year uptrend. This is a crucial market to watch over the next few weeks. The Russell 2000 is an index of small cap stocks. As such, it's appropriate to consider this index a measure of traders overall risk appetite. In addition, the index is currently testing the lows of its three year upward move. A decisive move below support would signal a change in traders risk appetite. In other words, in a more pronounced market correction the first stocks to get hit are the riskiest. This is what the Russell 2000 tracks.