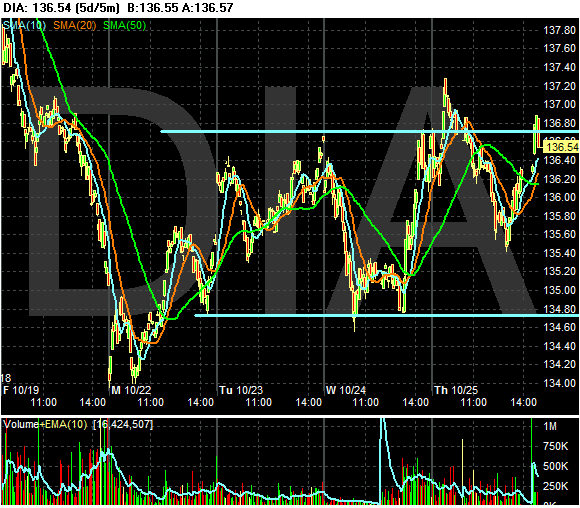
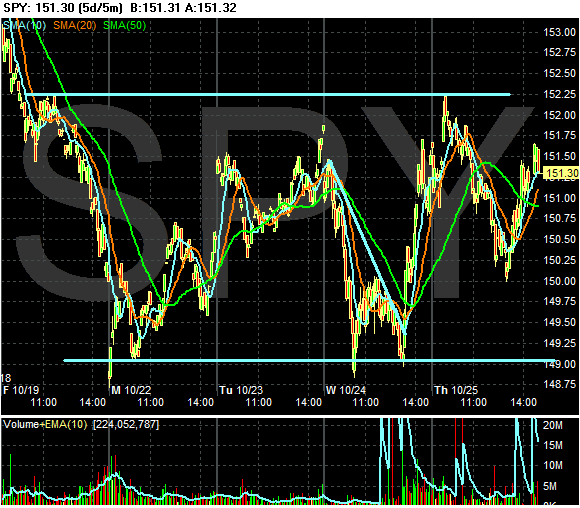
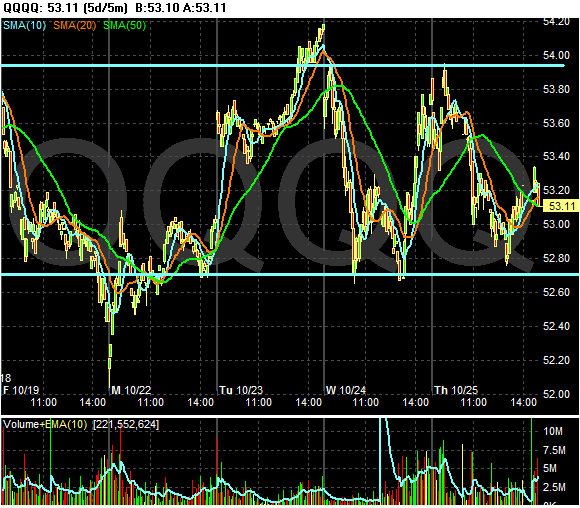
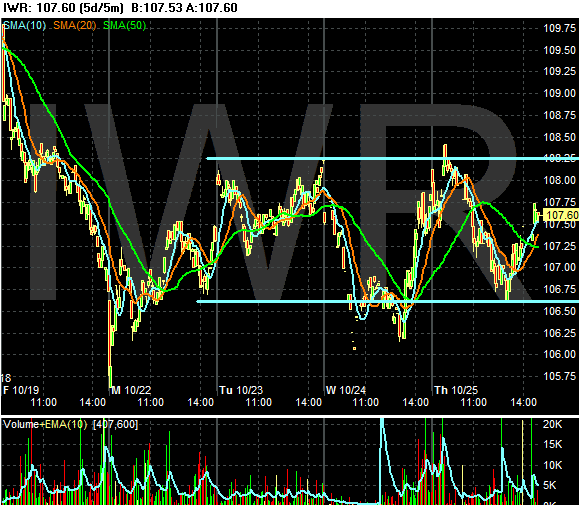
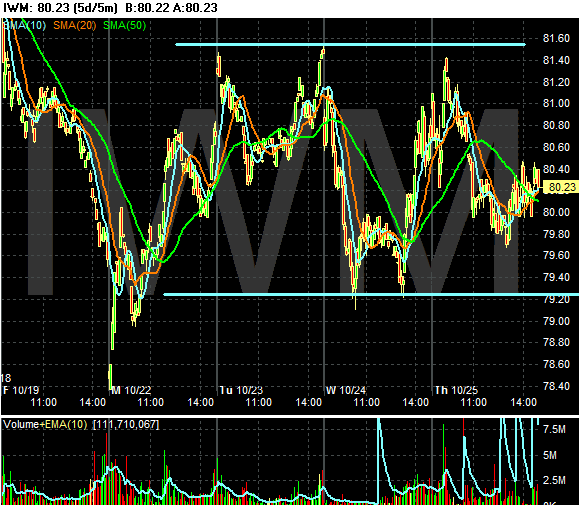
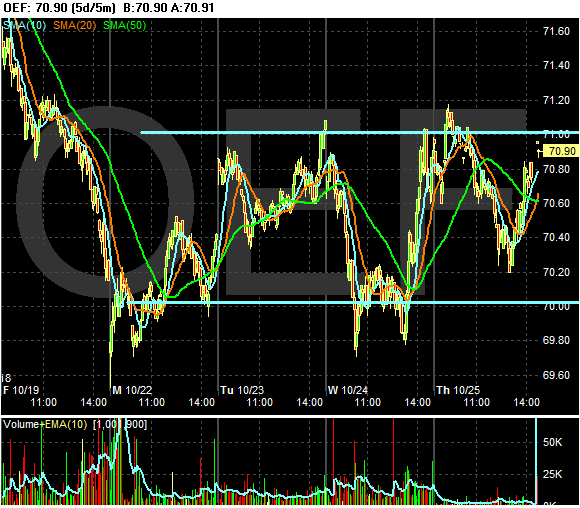
Simply put, a horizontal trading range indicates bullish and bearish sentiment is evenly matched. Over the last few days, we've had plenty of bearish news. Merrill Lynch posted huge write-down of assets, existing home sales tanked and durable goods orders fell for the second straight month. All of this should have sent the market lower.
But the news wasn't bad enough to break the lower band of all the trend lines. Why? I think the answer is the expectation that bad news increases the likelihood of another Fed rate cut. And with the Fed meeting approaching, traders aren't willing to sell just yet.
Anyway -- here are the 5-day, 5-minute charts of the DIAs, SPYs, QQQQs, IWRs, IWMs and OEFs == and they're all in a horizontal trading range.
