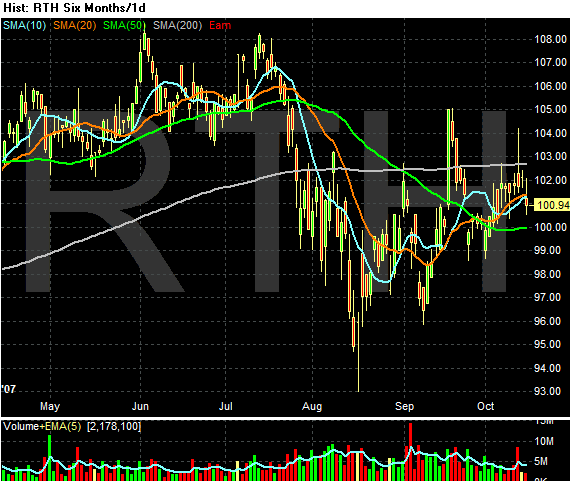
Yesterday I posted two stories (one on Target and one on Coach) that stated some retailers were showing signs of stress. The chart above -- which is the retailer ETF -- bears this out. Notice the index (whose three largest positions are in Home Depot, Target and Lowe's) is below the 200 day simple moving average (SMA) -- bearish territory. However, the index doesn't have a firm upward or downward bias and hasn't had one for about two and a half months. That means the index is consolidating and looking for signs about which way to go.
The direction may be bearish:
Companies ranging from pancake house chain IHOP to high-priced handbag seller Coach reported signs of the continuing U.S. consumer pullback, sending retail and some restaurant stocks lower.
Adding to the pressure, discounter Wal-Mart Stores cut its capital spending plan for the current fiscal year, dragging down U.S. stock indexes and boosting bonds.
Meanwhile, Target on Monday lowered its September sales expectations.
.....
On the restaurant side, IHOP posted an $11.6 million quarterly loss due to an interest-rate hedge it put in place related to its planned acquisition of Applebee's International.
But earnings from operations also came in below analysts' estimates and the company said fewer customers came into its restaurants.
Falling traffic was also an issue at Brinker International
Brinker International Inc which posted a 21 percent drop in quarterly profit.
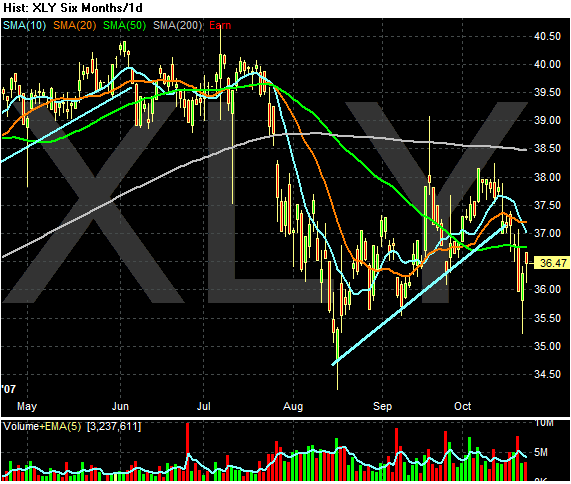
Unlike the retailers, the consumer discretionary ETF has a clear downward bias.
1.) It is below the 200 day SMA.
2.) It broke through a an upward trend a few days ago
3.) Prices are below the SMAs, which will pull the SMAs lower in the near future.
Other sectors of the consumer cyclical aren't looking good either.
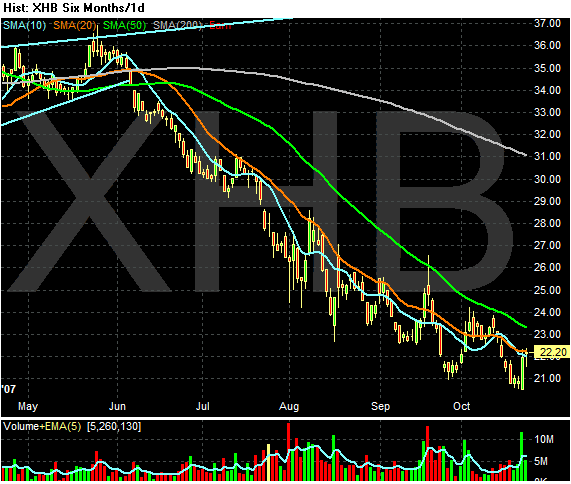
Homebuilders are heading lower -- and lower, and lower.
1.) Prices are below the 200 day SMA by a long margin.
2.) Prices are at or below all the SMAs
3.) The shorter SMAs are below the longer SMAs.
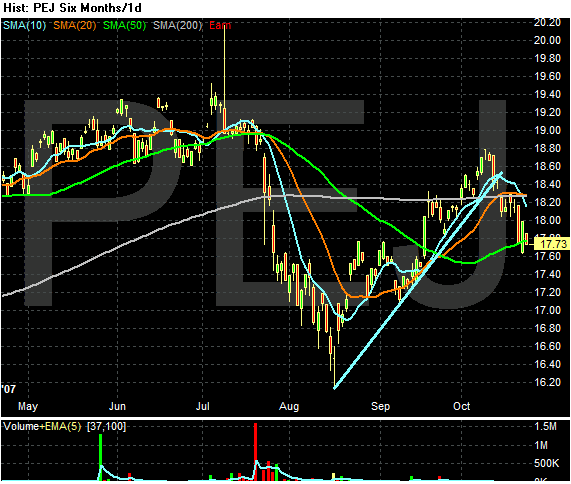
Consumer Leisure and Entertainment tried to get above the 200 day SMA, but just couldn't hold above that technically important line. Now the index is hugging the 50 day SMA for technical support. In addition, the ETF broke through a two month trend line about a week or so ago.
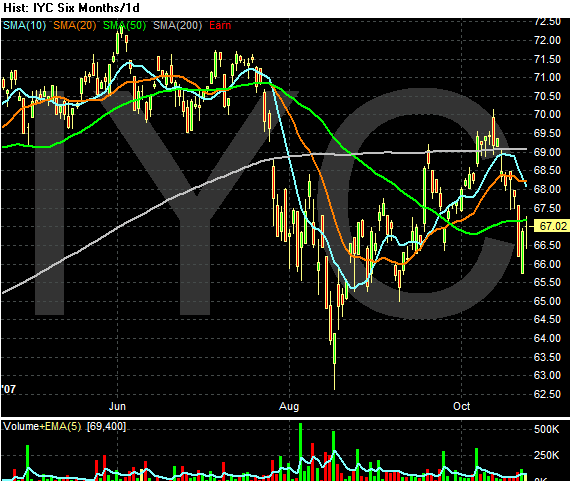
The Consumer Service ETF has the same technical characteristics as the consumer Leisure and Entertainment ETF. The one difference is prices here are below the 50 day SMA, making this chart technically weaker.
The bottom line is traders are definitely not confident in the US consumer right now.