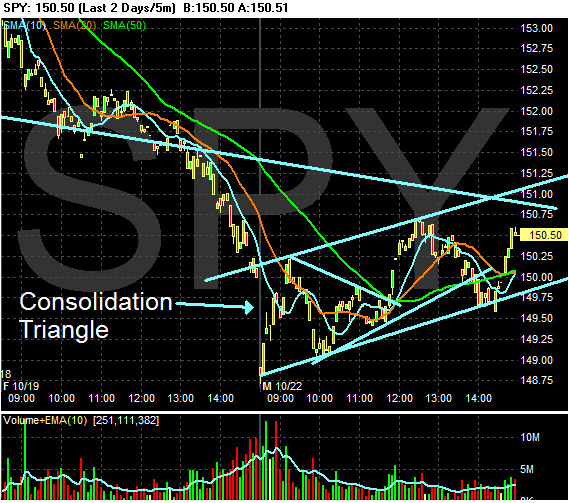
Futures were way down and traders were worried. However, the markets consolidated their losses in the morning in a triangle consolidation pattern, then rose slightly for the remainder of the day. It's important to remember that on the daily chart the SPYs were near the 50 day SMA, which is a technical support level.
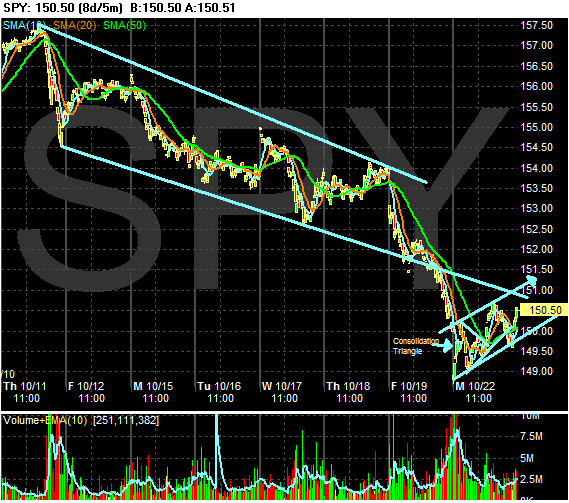
On the 8-day chart notice that today's action didn't break through the lower trend of last week's downward trend. In order to fully recover we'll need to move through that level.
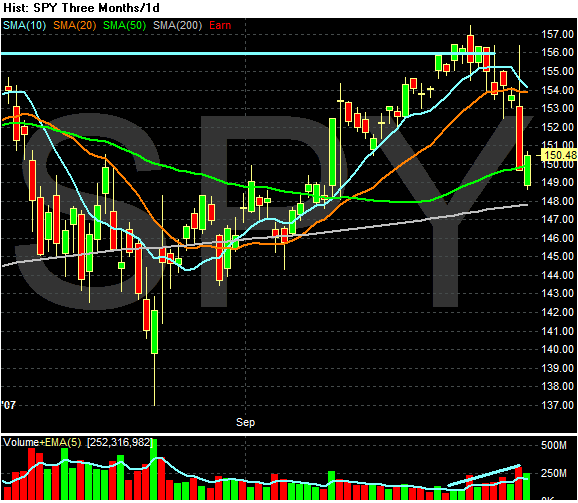
On the daily chart, note the 50 day SMA is acting as a center of gravity right now. Also note the 10 day SMA is heading lower and is about to move through the 20 day SMA. However, both of the smaller moving averages have a ways to go before either crosses the 50 day SMA. But also note that prices are below the 10 and 20 day SMA, which will continue to pull these numbers lower.
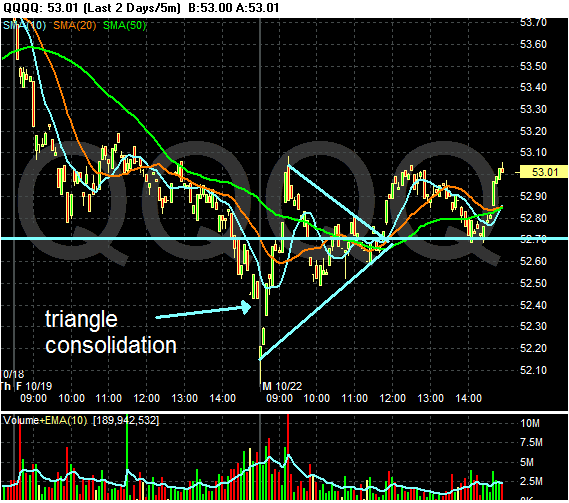
On the 2-day QQQQ chart, note the same pattern as the SPYs -- a triangle consolidation in the morning followed by a bit of a rally.
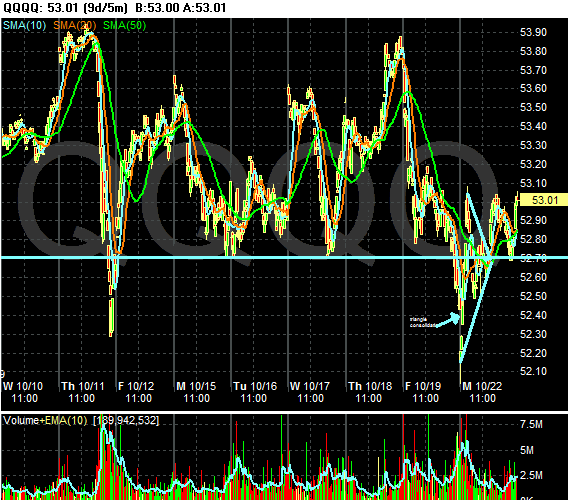
On the longer chart, notice the QQQQs have a trading range in place, and today's action broke through the lower trend line. That's technically good news.
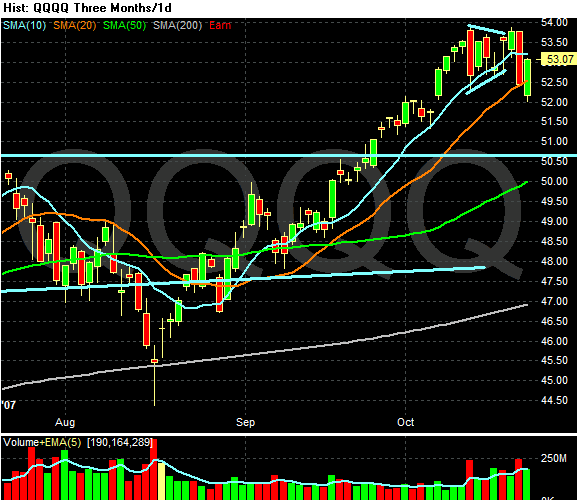
On the daily chart, notice we have a lot of traffic in the 52-54 area. But also notice that prices are still below the 10 day SMA, which acted with a bit of resistance in today's action.
Today felt like a "breather" from last week's action. There was no significant economic news, and the earnings news was decent. In addition, my guess is there are some bulls out there that are looking to buy on the dip.
But we get some housing news later this week as well as some other earnings out there.