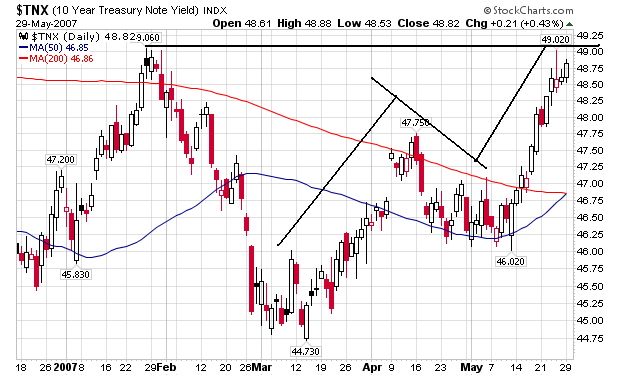
Notice the following.
1.) Prices sold-off starting in early March (remember, price and yield move inversely). They stabilized from late April to early May when they resumed their sell-off. The trading pattern is a standard rally, consolidation, rally pattern and indicates a fairly orderly path to the current price level.
2.) The 10-year yield is approaching a 6-month high.
Here's the weekly chart.
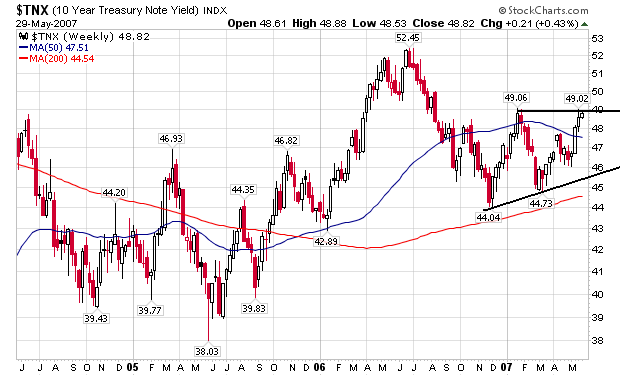
Prices have been in a trading range since late 2006. If they break from this range we could approach the multi-year highs in yield.