Saturday, June 18, 2022

Weekly Indicators for June 13 - 17 at Seeking Alpha


 - by New Deal democrat

My Weekly Indicators post is up at Seeking Alpha.

My paradigm is: first the long leading indicators turn. Then the short leading indicators turn. Then the coincident indicators turn. Finally the lagging indicators turn.

For months I have been documenting the downturn among the long leading indicators. In the past few weeks, that deterioration has been gradually spreading among the short leading indicators.

As usual, clicking over and reading will bring you up to the virtual moment as tho the state of the economy, and will bring me a small reward for my efforts as well.

Friday, June 17, 2022

Positive production print points to continued economic expansion in May


 - by New Deal democrat

The usual suspects are out, claiming that a recession has either already started or is imminent. Well, the big reason I call industrial production the King of Coincident Indicators is because empirically is the one whose peaks and troughs coincide most definitively with NBER recession dates. And unless there is a significant downward revision, in May the King of Coincident Indicators proclaimed: no recession yet.

Total production rose 0.2%, while manufacturing declined -0.1%. April’s overall number was also revised higher, from 1.1% to 1.4%, while manufacturing remained at +0.8%. The former made yet another new record high:


On a YoY basis, total production is up 5.8%, while manufacturing is up 4.9%. Compared with the last 40 years, and particularly the last 20, this remains pretty good growth:


A recession *could* start from these YoY numbers (see 1990 and 2007), but usually YoY production is decelerating pretty rapidly before a recession actually begins.

A close-up of the monthly changes since the depth of the pandemic recession shows that May was weak, like much other data for the month, but not indicative of any significant trend change yet:


With an employment gain of nearly 400,000, and (again, unless revised lower next month) a positive print on production, overall the economy continued to move forward in May.

Thursday, June 16, 2022

An across the board downturn for housing permits and starts in May


 - by New Deal democrat

Housing permits and starts declined across the board in May.

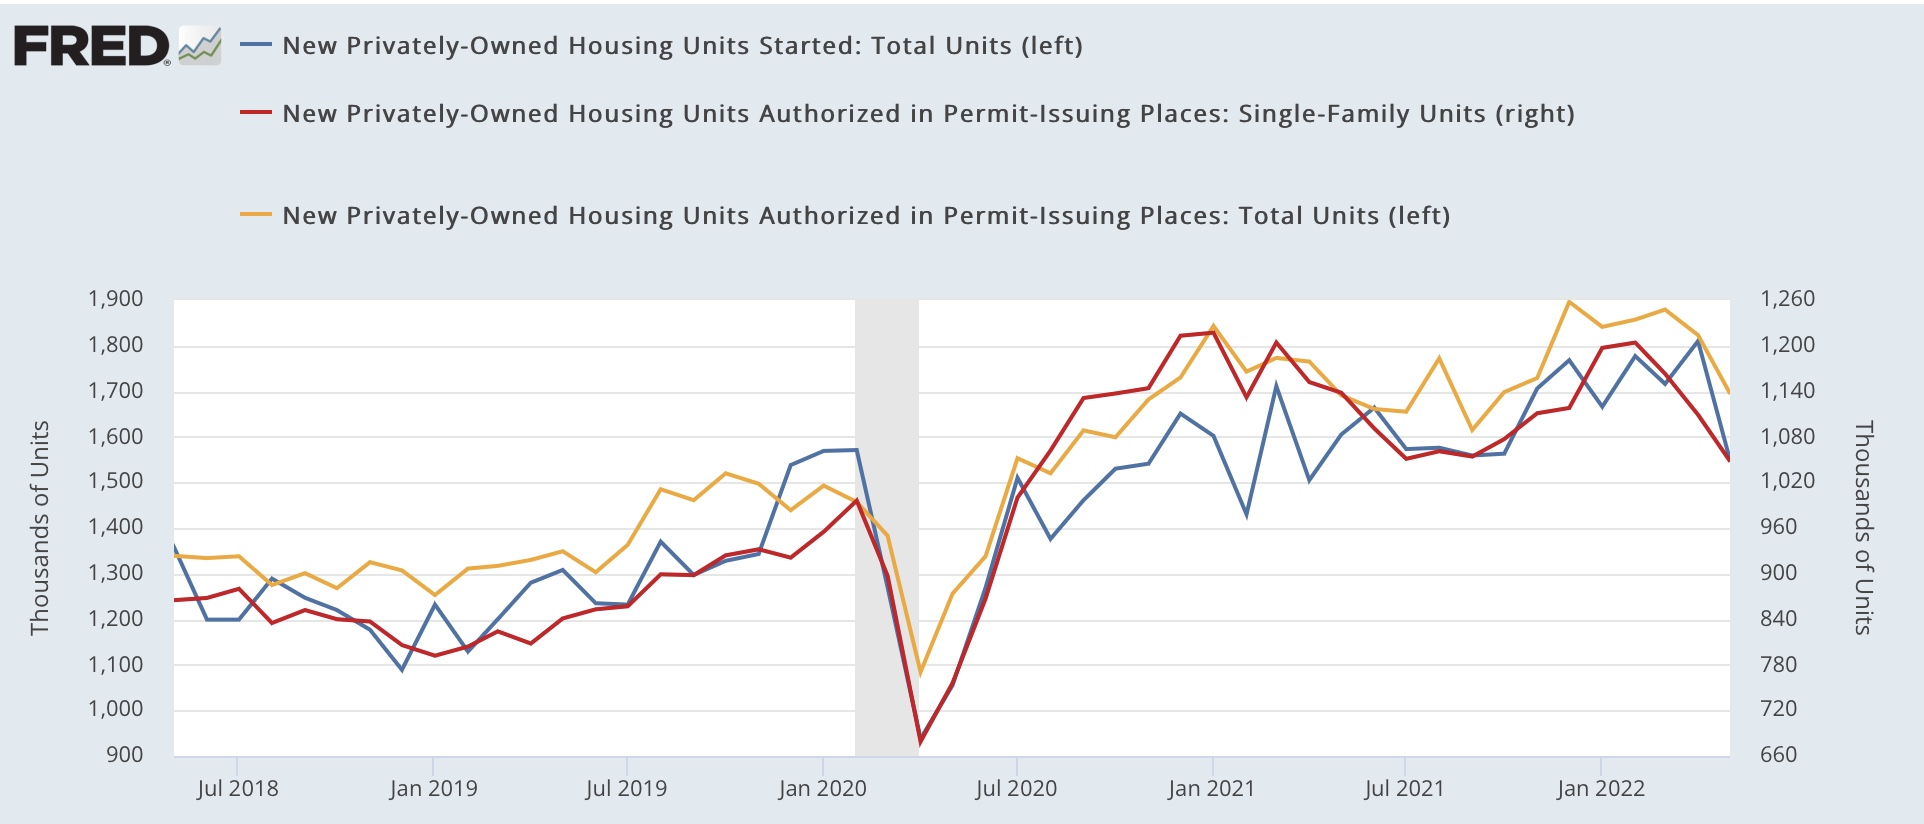
In the past year there has been a unique divergence between permits and starts due to construction supply shortages.  This has been reflected in the number of housing units authorized but not started increasing to a near-50 year records of 298.4 in March. In May that number increased from April by 1.5 million annualized to 287.6:


As a result, for the time being I am paying the most attention to the three month average of housing starts (blue in the graph below), as these reflect actual economic activity, vs. permits (gold) which are only potential activity. That three month average declined to 1.691 annualized, a 5 month low:


For the month, single family permits (red above, right scale) declined 61,000 annualized to 1.048 million, a 22 month low. Total permits declined 128,000 to 1.695 million annualized, an 8 month low, and starts declined for the month by 261,000 to 1.549 annualized, a 13 month low.

Finally, below is the most recent version of a graph I have run many times in the past 10 years, showing that mortgage interest rates (red, inverted *10 for scale) lead housing permits (gold) and starts (blue):


Interest rates are higher by 2% vs. one year ago. As the graph shows, the last time the comparison was this bad was 1994, resulting in a 20% decrease in permits and starts the following year. Both permits and starts have now turned negative YoY. 

The “demographic tailwind” that buoyed housing activity 5 and 10 years ago has dissipated, as the number of 25-35 year old first time buyers has stopped increasing. Thus I expect a 20% YoY decline in housing permits and starts to manifest over the coming 12 months. 

The conundrum is whether the 50 year high backlog in units not yet started will delay the downturn until it clears - which might take another 6 to 12 months. Since starts are the actual economic activity, until I see an unequivocal downturn there, the massive negative signal from permits, mortgage rates, and mortgage applications remains open to question.

The increasing trend in new jobless claims continues


 - by New Deal democrat

Initial jobless claims declined -3,000 to 229,000 last week, vs. the 50+ year low of 166,000 set in March. The 4 week average also rose 2,750 to 218,500, compared with the all-time low of 170,500 ten weeks ago.  Continuing claims rose 3,000 to 1,312,000, or 6,000 above their 50 year low of 2 weeks ago:


It’s now clear that initial claims have been in an uptrend over the past 2.5 months. If this continues until the end of this month, they will no longer qualify as a “positive” in my array of short leading indicators, although they have not risen to levels that would change their rating to a negative.

This is yet more slight weakening in the economic indicators, and yet more reason for concern about a recession as we get to 2023.

Wednesday, June 15, 2022

Negative May and YoY real retail sales add to the foreboding signals of a recession next year


 - by New Deal democrat

Nominal retail sales for the month of May declined -0.3%, and April was revised down by -0.2% to +0.7%. This reduces April’s number, after inflation to +0.4%, followed by a “real” decline in May of -1.2% after rounding. YoY real retail sales were up 8.1%, but because inflation in the past 12 months has been 8.5%, real retail sales YoY is down -0.4%. Here is a graph of the absolute value of real retail sales:


In the past 75 years, a decline in real retail sales YoY has frequently - but not always - indicated a recession. Here’s what the past 30 years look like:


Needless to say, not good news. 

Next let’s turn to employment, because real retail sales are also a good short leading indicator for jobs.

As I have written many times over the past 10+ years, real retail sales YoY/2 has a good record of leading jobs YoY with a lead time of about 3 to 6 months. That’s because demand for goods and services leads for the need to hire employees to fill that demand.  The exceptions have been right after the 2001 and 2008 recessions, when it took jobs longer to catch up, as shown in the graph below, averaged quarterly through the First Quarter: 


Now here is the monthly YoY comparison for the last year through May:


II have been writing for months that I have expected the blowout job numbers of about 500,000 per month to slow down to a range of about 100,000-300,000 per month by early autumn. The last 3 months have averaged 400,000, which has probably been the beginning of that slowdown.

Finally, real retail sales per capita is one of my long leading indicators. Here’s what it looks like for the past 25 years:


And here is the last year:


Last month’s good report temporarily switched the long leading signal from negative to neutral, but this month it goes back to negative - along with most of the rest of the long leading indicators, which have been increasingly foreboding about the economy next year.

Tuesday, June 14, 2022

On the road, and missing all the fun on Wall Street . . .


 - by New Deal democrat

I’m still on the road, and there is no important economic statistic to report, but I will make a brief market comment.


YoY stocks are now down 10%. Except for the very bad 1982 and 2008 recessions, and the 2000 Nasdaq bubble and the 1987 crash (which were prolonged bear markets), that has typically been close to their YoY lows:


And with rare exception that level has only been hit about midway through a recession.

The only time buying a broad basket of stocks at this price reduction has not been amply rewarded within after 2-3 years is during the 1929-32 Great Contraction.

< Sigh > I miss the days when I could read triumphalist diaries by DOOOMers at Daily Kos, who were infallible contrary indicators, and be sure that the bottom was in. 

On the other hand, here’s a 12 month graph of Tesla, recently valued at a level equal to if not exceeding the entire rest of the auto industry:


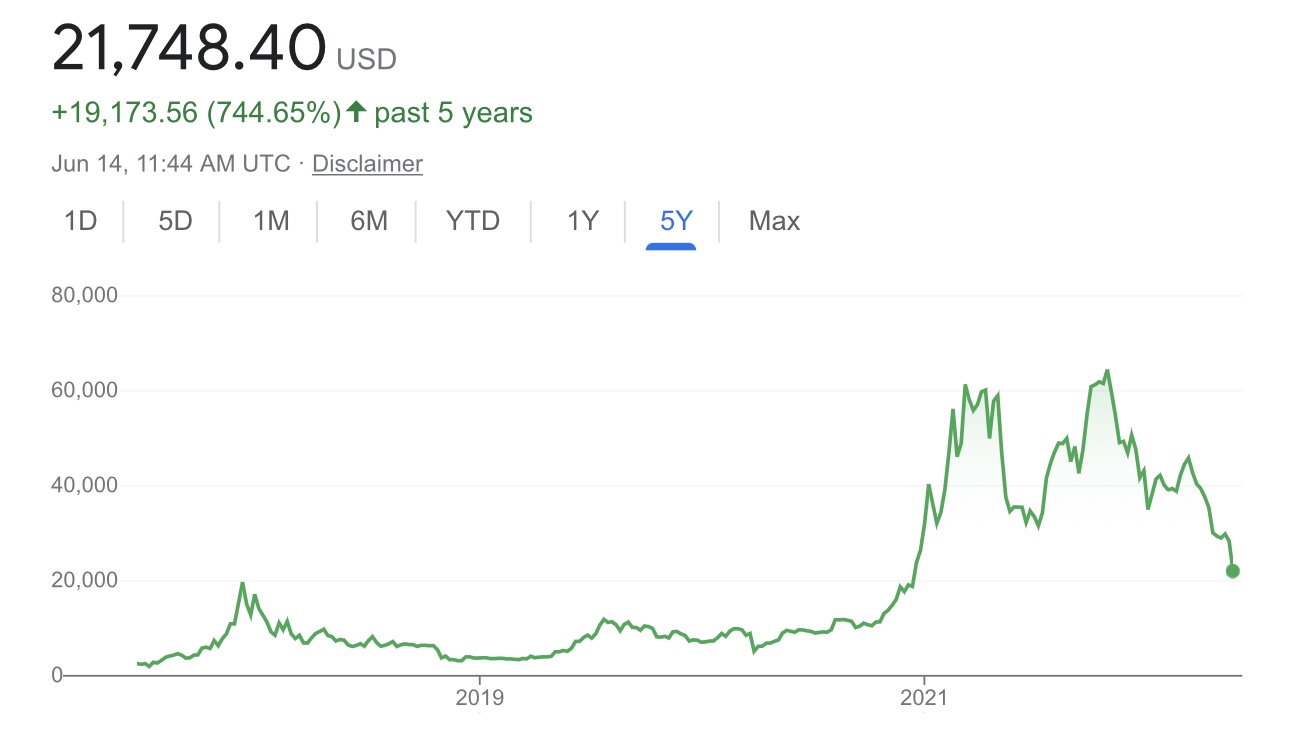
That’s a pretty severe price reduction. Until you zoom out to the 5 year perspective:


Is there any reason for Tesla still to be selling at 10x its price only 2 years ago?

And further, is there any reason for Bitcoin to exist at all?:


On the bright side, a lot of know-it-all smart mouthed 30 year olds are going to STFU.

Monday, June 13, 2022

Weekly Indicators for June 6 - 10 and a comment on COVID


 - by New Deal democrat

I’m still traveling, so light posting for a couple days more.


In fact, I neglected to post a link to my Weekly Indicators on Saturday. A bit tardy, here it is. Conditions across all time frames do not look so good, and with Friday’s poor inflation report, I expect the Fed to continue stomping on the brakes - especially since we know that the YoY change in rents and “owners’ equivalent rent,” which together make up about 1/3rd of all inflation, are likely to keep rising (since they lag house price indexes, which are still at or near their YoY high growth rates, by a year or more).

Meanwhile, there’s good news and bad news on the COVID front. For the last three weeks, cases have plateaued at roughly 105,000 per day, and deaths have varied between 275 and 340. So BA.4/5 does not seem to be creating any new “wave” at this point. Further, between April 4, the recent trough in cases, and one month ago, there were a cumulative total of about 2.150 million cases. With a one month lag, deaths totaled 12,300. That’s about a 0.6% fatality rate, or about 1 in 400 cases. So the good news is, over the population as a whole, COVID has recently had about a similar death rate to a bad year for seasonal flu.

The bad news is that the death rate is heavily concentrated towards the elderly. Among people under 50 years of age, in May there were only about 125 deaths total. For age 50-65, there were another 400; for 65-74, 700; for 75-84, 1000, and 85 and older, 1500. In other words, for seniors, and particularly those over age 80, COVID remains a deadly serious disease.

Friday, June 10, 2022

Consumer prices rise 1% in May alone; owners equivalent rent at 30 year high; expect the Fed to keep stomping on the brakes


 - by New Deal democrat

Today is a travel day for me, so I’ll keep this relatively brief.


People who were hoping inflation would abate did not get the news they wanted from the May CPI. Consumer prices rose 1.0% in that month alone. Inflation less energy rose 0.7%, and “core” inflation less food and energy rose 0.6%. On a YoY basis, prices are up 8.5%, tied for a multi-decade high with a few months ago. Core prices are up 6.0%, down slightly from their February and March peak:


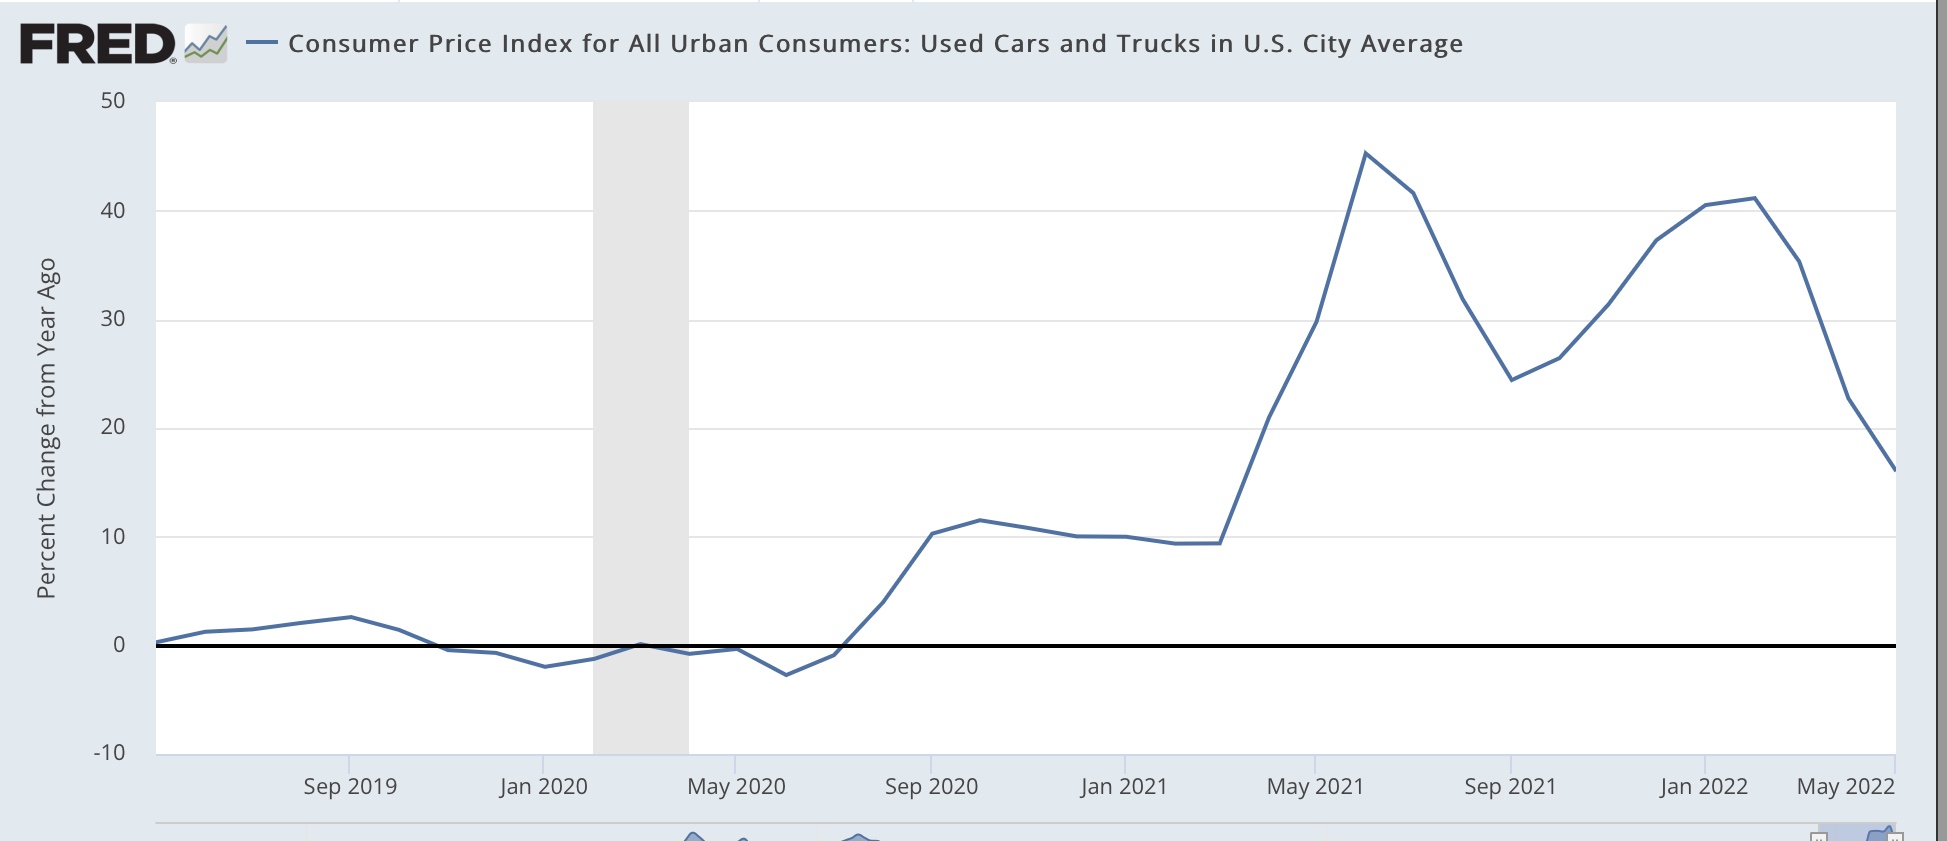
The news was relatively “good” in the prices of used cars and trucks, up 1.8% for the month, but “only” up 1.6.1% YoY, down from 45% half a year ago:


Finally, as expected, house prices (as shown via the FHFA Index in blue below) have continued to bleed over into owner’s equivalent rent, which rose 0.6% for the month, and is up 5.0% YoY, a 30 year high:


Bottom line: the Fed is going to continue stomping on the brakes. The only issue will be whether we get an old-fashioned “bust” before short term rates get raised high enough to invert the yield curve, a la the late 1940s and early 1950s.

Thursday, June 9, 2022

Initial jobless claims now in a clear uptrend, and other economic notes for the week


 - by New Deal democrat

First, a note on other economic news from earlier this week. 

The housing market is getting absolutely crushed by 10 year+ high mortgage rates. Mortgage applications fell to levels not seen since 2017 (except for a few weeks during the 2020 Covid lockdowns). Refinancing is at 20 year lows. The next questions are when prices will peak, and what will happen with the huge backlog in housing starts from properties already permitted? We’ll find out more in a week with the next report on housing starts and permits, but we won’t get more price information for a couple more weeks.

I saw a couple of comments on consumer credit increasing. As I’ve noted, the consumer is in a typical late expansion mode, where real income growth if flagging, and consumers are extending themselves on more credit. I don’t see anything drastic happening here.

I also read a few reports that retailers are reporting marked dips in sales in the past month. I think we have reached the point where gas prices are high enough that consumers are cutting back on other purchases. I doubt we’re at an “oil shock” point, though, where consumers *over*compensate becoming extra cautious about other purchases.

Finally, there’s been some discussion about the future course of inflation. One highly compensated Wall Street pundit claimed that consumer spending had not caused any inflation, because - wait for it - in inflation-adjusted terms, it had kept up with inflation. In other words, consumer spending behaved exactly as you would expect it to if more money were chasing the same amount of goods. Although that’s clearly *not* the case with gasoline and cars, where demand has never completely returned to pre-pandemic levels, and yet prices are much higher.

Meanwhile, Paul Krugman among others is touting that inflation may be subsiding, so the Fed should be wary of over-reacting. Measured by wages for non-managerial workers, it has abated just slightly, so I’m not so sure. Beyond that, as I’ve pointed out in a few recent missives, this is how Booms turned into Busts in the immediate aftermath of World War 2. The Fed never raised rates, but price and mortgage rate increases overwhelmed the ability of consumers to keep pace. So they didn’t. Inflation abated, because there were brief recessions which caused an abatement of interest rates and price increases. I.e., be careful what you wish for.

Turning to the news actually at hand  . . .

Initial jobless claims rose 27,000 to 229,000 last week, continuing above the recent 50+ year low of 166,000 set in March. The 4 week average also rose 8,000 to 215,000, compared with the all-time low of 170,500 nine weeks ago.  Meanwhile continuing claims were unchanged at 1,306,000, tied for a 50 year low:


It’s now safe to say that initial claims have been in an uptrend over the past 2.5 months. If this continues a few more weeks, they will no longer qualify as a “positive” in my array of short leading indicators. I will be interested to see if this is confirmed by a significant decline in the “job openings” category of the next release of the JOLTS report, which would indicate that employers are affirmatively cutting back on their hiring plans.

In any event, yet more (slight) weakening in the economic indicators, and yet more reason for concern as we get to 2023. A few weeks ago I went on “Recession Watch” beginning with Q1 2023 and noted that, because I rely in large part on Prof. Geoffrey Moore’s long leading indicators, which also were the basis for ECRI’s forecasts (the last time they were public about their metrics), I expected ECRI to start talking about recession as well.

Well, within the past week, via a Lakshman Achuthan interview on CNN, they have.

Tuesday, June 7, 2022

Coronavirus variant update: and on to the BA.4/5 wave


 - by New Deal democrat

Last week the CDC update showed variant “Ba.1.1.526” increasing quickly to 6.6% of all cases. Although they did not note it, I wrote that this was almost certainly Ba.4/5; they simply had not made the change yet.

Well, this week they did. This morning’s “nowcast” update of variants shows Ba.1.1.526 having vanished, with Ba.4/5 having taken its place, and having doubled to 13% of all cases in the past week, even as Ba.2.12.1 slowly increased from 59% to 62%:


Here’s the regional breakout:


Ba.2.12.1 now makes up a little over 80% of cases in NY, NJ, and PR, while BA.4/5 combined make up 18% of all cases in the northern Rockies and 22% of the southern Plains, including Texas.

It is unclear it this point how much, if at all, nationwide cases will increase. It depends on how much Ba.2.12.1 fades compared with how quickly Ba.4/5 take over. In South Africa, the Ba.4/5 wave rolled in and out very quickly earlier this spring:


There the Ba.4/5 wave rolled in over about a 3 week period, and rolled out almost as quickly. Cases were only 1/3rd as many as the original Omircron wave at peak, while deaths were only 1/5th as high. Hopefully the same will happen here. 

Monday, June 6, 2022

Coronavirus dashboard for June 6: transitioning ever so gradually into a less fatal endemic condition


 - by New Deal democrat

The economic calendar is very light this week, with no significant news until Thursday, so let’s take this opportunity to update the situation with COVID-19.


First, as of one week ago subvariant BA.2.12.1 continues to increase very slowly its share of overall cases, up to 59% nationwide:


This subvariant makes up 78% of cases in NY and NJ, but only 38% in the Northwest. Meanwhile new subvariants BA.4/5 (still listed as BA.1.1.529 by the CDC) has risen to 6.1% of all cases, with a high of 12.4% in the northern Great Plains, and a low of 2.9% in NY and NJ:


The BA.2.12.1 wave appears to have peaked 8 days ago, at 115,700 cases. It is presently down to 106,800. Meanwhile deaths have *still* continued to decline from their Omicron peak of February, making a new 10 month low of 258 on June 3rd:


Hospitalizations have continued to increase, up to just over 29,000, compared to their low of 10,264 on April 6:


The trend of COVID not being nearly so lethal as it was originally (regardless of the causation) continues. Two really important trends stand out.


The first is that we are now more than 2 full months after the post-Omicron trough, and yet deaths have continued to ever so slowly decline, as noted above making a new low just a few days ago. Typically, as is shown in the chart below, hospitalizations have made peaks and troughs simultaneously with or just slightly after cases, while deaths make equivalent peaks or troughs within 3-4 weeks later:


Event 

Peak

Cases

Date

Hosps

Date 

Deaths

Date


Alpha  

1/11/21

1/9/21

1/13/21


Delta

9/5/21

8/27/21

9/21/21


Omicron

1/15/22

1/15/22

2/1/22


BA.2.12.1

6/3/22*

N/a

N/a


Event

Trough


Alpha

6/21/21

6/25/21

7/8/21


Delta

10/26/21

11/5/21

11/27/21


Omicron

4/4/22

4/6/22

6/3/22*


BA.2.12.1

N/a

N/a

N/a


---


---


So the fact that deaths are *still* declining more than 2 months after cases started to rise again speaks of a big change having happened.


Secondly, when we look comparatively at hospitalizations and deaths vs. confirmed cases, we see that with each successive wave, there are fewer hospitalizations vs. confirmed cases, and even fewer deaths.


The below chart norms the “Alpha” wave of winter 2020-21 to 1.00 for all metrics, and then compares successive peaks and troughs of subsequent waves with that respective peak and trough.


Note that, with one exception (hospitalizations due to Delta at peak), hospitalizations rose less and fell more than cases did during each successive wave after Alpha. Deaths have declined comparatively even more:


Event 

Peak

Cases

#

(Thous.)

Hosps.

#

(Thous.)

Deaths

#

(Number)


Alpha  

1.00 (251.8)

1.00 (117.7)

1.00 (3,393)


Delta

0.66 (166.2)

0.74 (87.4)

0.62 (2,117)


Omicron

3.21 (807.8)

1.31 (154.0)

0.77 (2,609)


BA.2.12.1

0.46* (115.7)

0.25* (29.0)

N/a


Event

Trough


Alpha

1.00 (11.5)

1.00 (13.1)

1.00 (223)


Delta

6.17 (70.9)

2.71 (35.5)

3.68 (821)


Omicron

2.32 (26.7)

0.77 (10.3)

1.16* (258)


BA.2.12.1

N/a

N/a

N/a


---


---


At the peak of Omicron in January, more than 3x as many people had confirmed cases as compared with Alpha, but there were only 1.3x as many hospitalizations, and less than 0.8x as many deaths.


As of the most recent post-Omicron trough, cases were still nearly 3x as high as the post-Alpha trough, but hospitalizations made a new all-time low of .77x compared with the post-Alpha trough, and deaths - still declining as of a few days ago - are less than 1.2x as many as the post-Alpha trough.


Probably the recent relative decline is hospitalizations is due more than anything else to Paxlovid, which when taken promptly after the onset of symptoms, has been very effective.


When it comes to deaths, the causation may be one or more of many things: an inherent weakening of the successive variants, resistance due to the prevalence of vaccinations and/or previous infections in the population, more effective treatments in the hospital, or simply that the most vulnerable population already died of the disease, so there are many few extremely susceptible individuals left - or something else, or any combination of the above.


But, whatever the reason, COVID now has the approximate fatality rate as a typical  bad flu season. I expect new variants and new waves of COVID to continue, but appears more and more likely that it is ever so gradually transforming into an endemic condition.


Saturday, June 4, 2022

Weekly Indicators for May 30 - June 3 at Seeking Alpha


 - by New Deal democrat

My Weekly Indicators post is up at Seeking Alpha.

The slow drip, drip, drip of decelerating or declining data is continuing, as among other things, the YoY increase in withholding tax payments from workers has declined significantly in the past month.

As usual, clicking over and reading will bring you up to the virtual moment in what is happening in the economy, and reward me a little bit for my efforts.

Friday, June 3, 2022

May jobs report: a little softening, but very positive; non-managerial workers are now working *more* total hours than before the pandemic


 - by New Deal democrat

Like the past few months, I was most interested in three main issues:

1. Is the pace of job growth decelerating?  (Yes, but it is still very strong by historical standards)
2. Is wage growth holding up? Is it accelerating? (It is still strong, but decelerated again slightly)
3. Are the leading indicators in the report beginning to flag? (Not yet)

We still have 822,000 jobs, or 0.5% of the total to go to equal the number of employees in February 2020 just before the pandemic hit. At the current average rate for the past 6 months of 505,000 jobs added per month, that’s 2 months from now. Perhaps even more importantly, non-managerial workers are now working in total *more* hours than they did before the pandemic hit.

Here’s my in depth synopsis of the report:

HEADLINES:
  • 390,000 jobs added. Private sector jobs increased 333,000. Government jobs increased by 57,000 jobs. 
  • The alternate, and more volatile measure in the household report indicated a gain of 321,000 jobs. The above household number factors into the unemployment and underemployment rates below.
  • U3 unemployment rate was unchanged 3.6%, 0.1% above the January 2020 low of 3.5%.
  • U6 underemployment rate *rose* 0.1% to 7.1%, 0.2% above the January 2020 low of 6.9%.
  • Those not in the labor force at all, but who want a job now, declined -178,000 to 5.681 million, compared with 4.996 million in February 2020.
  • Those on temporary layoff declined -43,000 to 810,000.
  • Permanent job losers were unchanged at 1,386,000.
  • March was revised downward by -30,000, but April was revised upward by 8,000, for a net decline of -22,000 jobs compared with previous reports.
Leading employment indicators of a slowdown or recession

These are leading sectors for the economy overall, and will help us gauge whether the strong rebound from the pandemic will continue.  These were positive:
  • the average manufacturing workweek, one of the 10 components of the Index of Leading Indicators, was unchanged at 41.3 hours (but last month was revised down -0.1%).
  • Manufacturing jobs increased 18,000. Since the beginning of the pandemic, manufacturing is now down only -17,000 jobs, or -0.1% of the total.
  • Construction jobs increased 36,000. All of the jobs lost during the pandemic, plus another 774,000, have been made up. 
  • Residential construction jobs, which are even more leading, increased 5,000. Since the beginning of the pandemic about 60,000 jobs have been gained in this sector.
  • Temporary jobs rose by 19,300. Since the beginning of the pandemic, about  250,000 jobs have been gained.
  • the number of people unemployed for 5 weeks or less declined by -161,000 to 2,066,000, which is 57,000 *lower* than just before the pandemic hit.
  • Professional and business employment increased by 75,000, which is about 800,000 above its pre-pandemic peak.

Wages of non-managerial workers
  • Average Hourly Earnings for Production and Nonsupervisory Personnel: rose $0.15 to $27.33, which is a 6.5% YoY gain, down from its 6.7% peak at the beginning of this year.

Aggregate hours and wages:
  • the index of aggregate hours worked for non-managerial workers rose by 0.3%, which is now 0.2% *above* its level just before the pandemic.
  •  the index of aggregate payrolls for non-managerial workers rose by 0.8%, which is a gain of 14.0% (before inflation) since just before the pandemic.

Other significant data:
  • Leisure and hospitality jobs, which were the most hard-hit during the pandemic, rose 84,000, but are still -1,345,000, or -7.9% below their pre-pandemic peak.
  • Within the leisure and hospitality sector, food and drink establishments added 46,100 jobs, and is still -750,700, or -6.1% below their pre-pandemic peak.
  • Full time jobs rose 733,000 in the household report.
  • Part time jobs declined -325,000 in the household report.
  • The number of job holders who were part time for economic reasons rose 295,000 to 4,328,000, which is still below their level before the pandemic began, although it is 611,000 above their low this past January.
  • The Labor Force Participation Rate rose 0.1% to 62.3%, vs. 63.4% in February 2020.

SUMMARY

One month ago, while the Establishment report was very good, the Household report was not good at all. This month both sides of the jobs report were very positive.

While the pace of jobs growth isn’t as blistering as previously, it is still excellent by ordinary standards. The unemployment rate is still near historic lows. The leading sectors are almost all positive, indicating growth should continue. Wage growth is still very strong. With the exception of labor and hospitality, plus education, almost all sectors of the jobs market have made up, or almost entirely made up, their pandemic losses. In another two to three months we are likely to have more jobs than we did before the pandemic hit. What’s more, non-supervisory workers in total are now working a total of *more* hours than they did before the pandemic hit.

About the only soft spots were the upward tick in the underemployment rate, part of which was the continued increase in involuntary part-time workers, the 0.2% decline from best levels in the manufacturing workweek, and the second month in a row of downward revisions to previous reports. 

In short, a little softening, but still very positive.

Thursday, June 2, 2022

April JOLTS report: record low layoffs, still near record high quits and job openings


 - by New Deal democrat


Late last year I introduced the idea that the jobs market was similar to a game of musical chairs, where employers added or took away chairs, and employees tried to best allocate themselves among the chairs. Because of the pandemic, there have been  several million fewer players trying to sit in those chairs, leaving many empty. Additionally, there is 10% greater demand for goods and services in total in the past year than there was before the 2021 stimulus payments. As a result, wages have continued to increase sharply, as employers attempt to attract potential employees to sit in the continuing big number of empty chairs.

I’ve further posited that the game of musical chairs will only slow down once some employers throw in the towel, and the number of job openings signficantly declines.

In April, as yesterday’s Census Bureau JOLTS report shows, the game of musical job chairs in the jobs market has actually intensified to all-time levels. Specifically, both job openings and quits made all-time highs, and total separations during their entire 20 year history were only higher in March and April 2020.

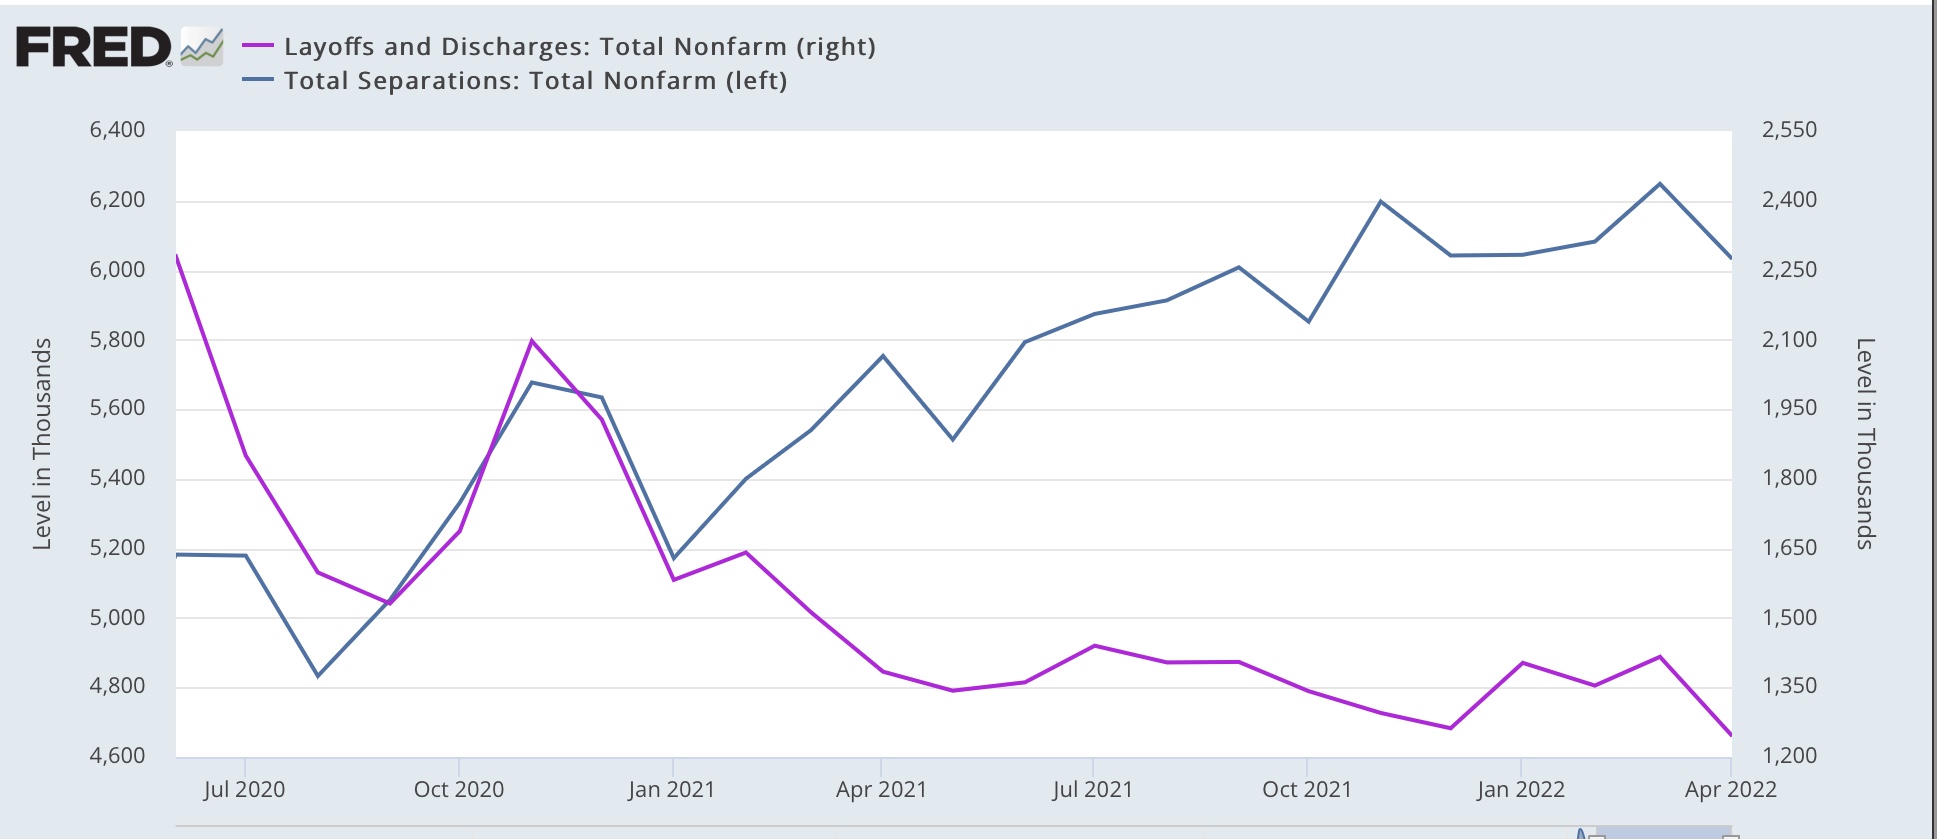
Layoffs and discharges (violet, right scale in the graph below) declined -170,000 to 1.246million, a new all-time low. Total separations (blue) declined -215,000 to 6.033 million (graph starts in June 2020 for reasons of scale):


For all intents and purposes, nobody is getting laid off.

Meanwhile, job openings (blue in the graph below) declined -455,000 to 11.4 million vs. their all-time high of 11.855 million one month ago. Voluntary quits (the “great resignation,” gold, right scale) declined -25,000 to 4.424 million. Actual hires (red) declined -59,000 to 6.586 million, vs. February’s all-time high of 6.832 million:


Importantly, there has been a sharp *deceleration* in the rate of YoY growth of both quits (to 10.2%) and job openings (to 23.0%). But those rates still constitute red hot growth vs. virtually any other time in the past 20 years:


In particular, in the past 6 months, vs. 23.0%, openings have grown at a 5.6% annualized rate, and in the past 3 months, at a 4.2% annualized rate. Openings could have peaked in March, or may continue to slowly rise for another 3 or 6 months.

In summary, the competition by employers to attract employees is still near a record. Employers aren’t laying anybody off, and the trend of workers quitting for better-paying jobs also continues at a near record pace. As a result, I expect wages to continue to increase sharply. Only when the trend in job openings rolls over, based on a 3 month average, do I expect to see a change in the underlying job market.

Initial claims stabilize, yet another 50+ year low in continuing claims


 - by New Deal democrat


Initial jobless claims declined 11,000 to 200,000 last week, continuing above the recent 50+ year low of 166,000 set in March. Meanwhile the 4 week average declined 500 to 206,500, compared with the all-time low of 170,500 set eight weeks ago.  Meanwhile continuing claims declined 34,000 to yet another 50 year low of 1,309,000:


Initial claims have trended slightly higher over the past 2.5 months, indicating a little cooling in the white hot employment market, but no real trend change. The almost complete lack of layoffs, and the attendant “Great Resignation” in favor of jobs with higher pay remains  the brightest spot in the entire economy.

Wednesday, June 1, 2022

Manufacturing and construction continue to be positive for the months ahead


 - by New Deal democrat

Let’s take a look at the new month’s first data, on manufacturing and construction.

The ISM manufacturing index, and especially its new orders subindex, is an important short leading indicator for the production sector. In May both increased, by 0.7 to 56.1, and by 1.6 to 55.1, respectively. The breakeven point between expansion and contraction is 50, so these both remain solidly positive, if not white hot like they were during last year’s Boom (new orders shown in graph below):


This forecasts continued economic expansion on the production side through summer into early autumn.

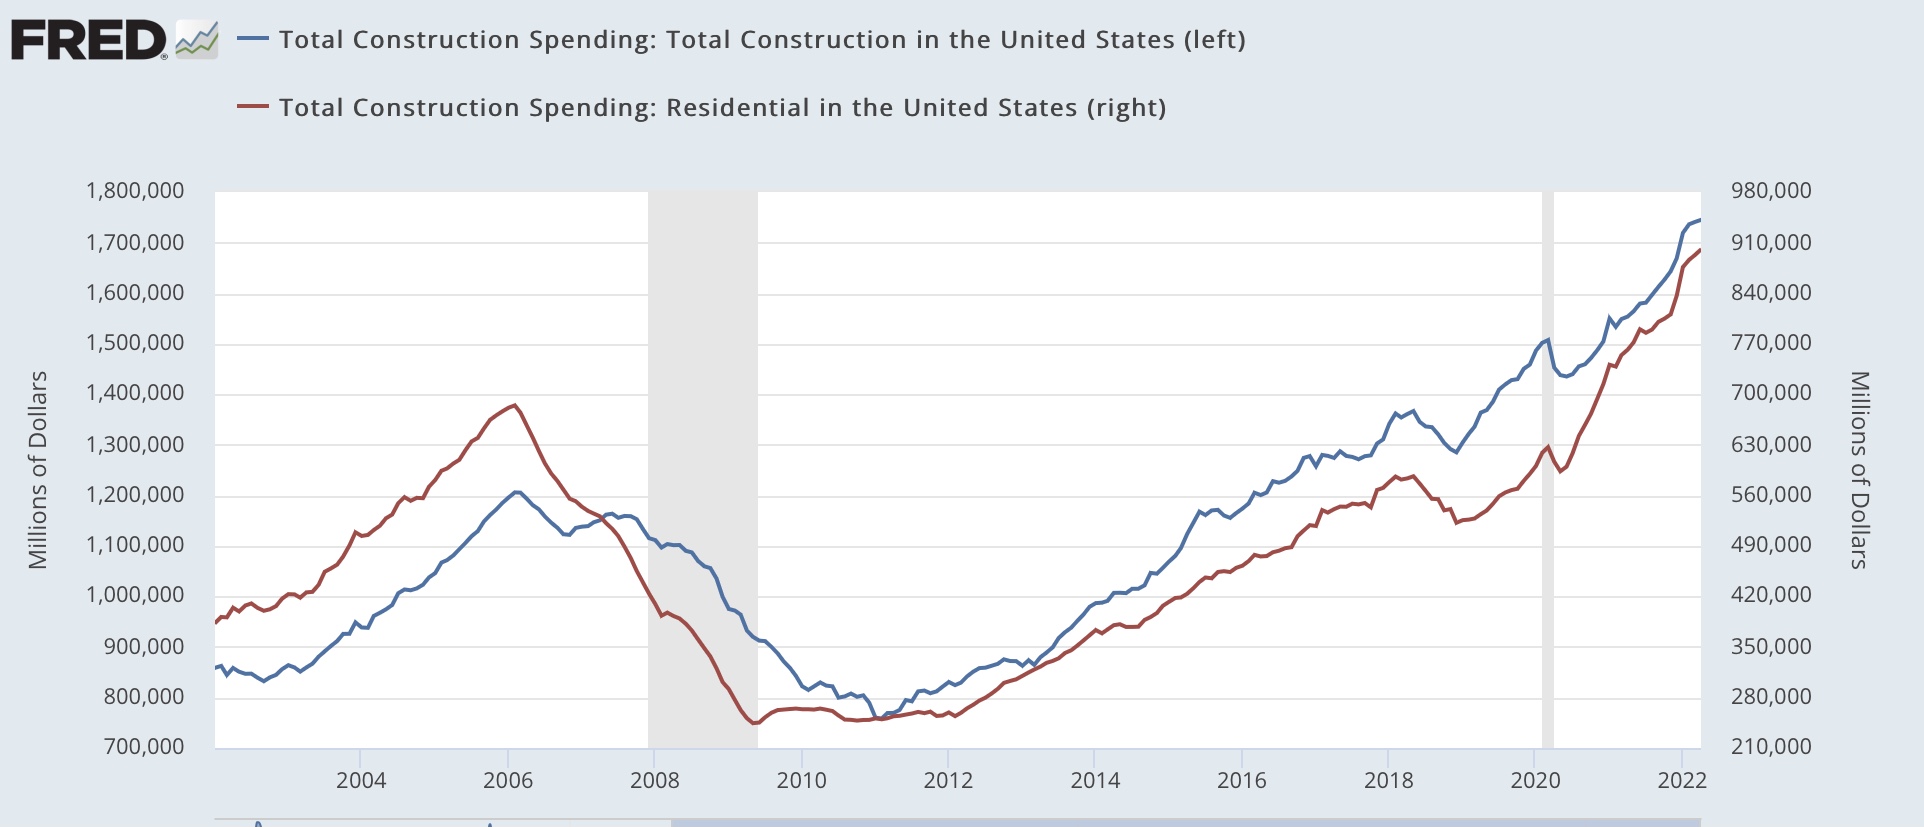
Meanwhile, construction spending rose 0.2% in nominal terms in April, and March’s number was revised up 0.2% to 0.3%. The more leading residential sector rose 0.9%, both thus making new highs:


On a YoY basis, nominal residential construction spending is up 18.4%.

Adjusting for price changes in construction materials, which declined -0.2% for the month, and have been almost exactly unchanged since January, “real” construction spending rose 0.4% m/m, and residential spending rose 1.1% m/m. In absolute terms, “real” construction spending has declined sharply - by -16.7% - since its peak in November 2020,  while “real” residential construction spending has declined -9.4% since its post-recession peak in January of last year, and has risen by about 6% in the past six months:


While total construction spending has declined by more than the -10.4% it did before the Great Recession, the decline in residential construction spending, while substantial, at its worst was only as bad as its 2018-19 decline, and was nowhere near the -40.1% decline it suffered before the end of 2007. In general these two series have been helped considerably by the fact that the cost of construction materials has stopped rising this year.

Mindful of the fact that it takes awhile for the downturn in mortgage applications, sales, and permits to filter through into actual construction, especially with record numbers of housing units permitted but not yet started, these two reports point to continued growth, albeit at a slower pace than last year, in manufacturing and construction in the next few months.