It's been awhile since I looked in detail at the US economy. As it so happens, over the last few weeks we've had both the most recent Beige Book issued by the Federal Reserve and the latest GDP report from the BEA. So this week I'm going to delve into US economy data to see just exactly where we are.
Let's start with a few basic points.
The US economy is growing and has been growing for the last three years. Currently, on an inflation adjusted basis, GDP is now higher than it was at the end of the last expansion.
The basic problem is that we're not growing fast enough. On a year over year basis, the US economy has been growing at between 2%-2.5% for the duration of this expansion. That's the slowest rate of year over year growth we've seen in the last 50 years. The slow growth is to be expected, as we're in the middle of a debt deflation recovery.
Assuming, accordingly, that, at some point of time, a state of over-indebtedness exists, this will tend to lead to liquidation, throughthe alarm either of debtors or creditors or both. Then we may deduce the following chain of consequences in nine links: (1) Debt liquidation leads to distress setting and to (2) Contraction of deposit currency, as bank loans are paid off, and to a slowing down of velocity of circulation. This contraction of deposits and of their velocity, precipitated by distress selling, causes (3) A fall in the level of prices, in other words, a swelling of the dollar. Assuming, as above stated, that this fall of prices is not interfered with by reflation or otherwise, there must be (4) A still greater fall in the net worths of business, precipitating bankruptcies and (5) A like fall in profits, which in a " capitalistic," that is, a private-profit society, leads the concerns which are running at a loss to make (6) A reduction in output, in trade and in employment of labor. These losses, bankruptcies, and unemployment, lead to (7) Pessimism
and loss of confidence, which in turn lead to (8) Hoarding and slowing down still more the velocity of circulation.The above eight changes cause (9) Complicated disturbances in the rates of interest, in particular, a fall in the nominal, or money, rates and a rise in the real, of commodity, rates of interest.
Bonddad is on vacation this week, so I've written some posts in advance that don't require stock charts.
To get an idea for how economists are talking about this recovery, consider this overview of the economy from the latest Beige Book:
Reports from the twelve Federal Reserve Districts suggest overall
economic activity expanded at a moderate pace during the reporting
period from late February to early April. Activity in the Cleveland,
Richmond, St. Louis, Minneapolis, and Kansas City Districts was
characterized as growing at a moderate pace, while the Boston,
Philadelphia, Atlanta, Chicago, and San Francisco Districts noted modest
growth. The New York and Dallas Districts indicated that the pace of
expansion accelerated slightly since the previous Beige Book.
The word "moderate" has become the Fed's favorite adjective.
Monday, April 29, 2013
Sunday, April 28, 2013
A Note To Erika Johnsen of Hot Air -- Austerity is Dead
Hot Air is one of the conservative blogs I read. And while they're good at explaining conservative political opinions, they are absolutely horrible about explaining economics.
Case in point.
Erika Johnson is up in arms about the French criticizing the German's continued insistence on austerity as the primary method of dealing with the EU's problem. She writes:
French President Francois Hollande is in a world of political hurt right now in terms of his failure to reignite the stagnating French economy, his flailing administration’s poor ethical reputation, and his attempts to simultaneously satisfy both his campaign pledges and his EU-promises, it looks like his party is thinking about deploying the ol’ unite-behind-a-common-outside-enemy tactic to try and rally the troops. That’s right: German Chancellor Angela Merkel, because all of these debt crises and austerity measures are totally all her fault, you guys!
First, France is in a world of economic hurt. She got this one right. It's a big reason I'm bearish on the economy there (see here and here).
But it's also obvious that she hasn't been paying attention to economics for, I don't know, about 4 years. You see, Ms. Johnson, there has been a debate about "austerity" and it's policy implications. First, notice that countries that implemented austerity just aren't growing as advertised. For example, there's Spain:
Spain admitted on Friday that it would need two extra years to bring its budget deficit back below the EU limit of 3 per cent of gross domestic product, a relaxation of its austerity targets that won tacit approval from Brussels.
Spain has been implementing austerity for a few years now -- and look how much good it's done the country:
That is a track record of success that I'd hang my economic policy hat on.
And then there's the UK -- which just narrowly missed printing a triple dip recession (there's a sign of progress) with a whopping .3% GDP reading in the latest report. Their plan of fiscal consolidation is going so well that .. "The chancellor’s rolling five-year plan to eliminate the underlying deficit, originally intended to achieve its objective by 2016, will be extended until 2018 because of low growth." Where's the stellar growth from austerity?
You can see similar track records all across countries that are implementing austerity.
And her sudden love of Germany is a bit odd. After all, they have and encourage strong labor unions, promote alternative energy and have socialized medicine. They also used fiscal stimulus to limit the effects of the recession Doesn't their success invalidate the majority of her economic theories?
So, a note to Ms. Johnson.
Please make sure you're up-top-date on current economic theory before commenting on economics. Recent developments have invalidated austerity based policy. Your nemesis Paul Krugman is in fact the victor:
For the past five years, a fierce war of words and policies has been fought in America and other economically challenged countries around the world.
On one side were economists and politicians who wanted to increase government spending to offset weakness in the private sector. This "stimulus" spending, economists like Paul Krugman argued, would help reduce unemployment and prop up economic growth until the private sector healed itself and began to spend again.
On the other side were economists and politicians who wanted to cut spending to reduce deficits and "restore confidence." Government stimulus, these folks argued, would only increase debt loads, which were already alarmingly high. If governments did not cut spending, countries would soon cross a deadly debt-to-GDP threshold, after which economic growth would be permanently impaired. The countries would also be beset by hyper-inflation, as bond investors suddenly freaked out and demanded higher interest rates. Once government spending was cut, this theory went, deficits would shrink and "confidence" would return.
.....
The argument is over. Paul Krugman has won. The only question now is whether the folks who have been arguing that we have no choice but to cut government spending while the economy is still weak will be big enough to admit that.
Case in point.
Erika Johnson is up in arms about the French criticizing the German's continued insistence on austerity as the primary method of dealing with the EU's problem. She writes:
French President Francois Hollande is in a world of political hurt right now in terms of his failure to reignite the stagnating French economy, his flailing administration’s poor ethical reputation, and his attempts to simultaneously satisfy both his campaign pledges and his EU-promises, it looks like his party is thinking about deploying the ol’ unite-behind-a-common-outside-enemy tactic to try and rally the troops. That’s right: German Chancellor Angela Merkel, because all of these debt crises and austerity measures are totally all her fault, you guys!
First, France is in a world of economic hurt. She got this one right. It's a big reason I'm bearish on the economy there (see here and here).
But it's also obvious that she hasn't been paying attention to economics for, I don't know, about 4 years. You see, Ms. Johnson, there has been a debate about "austerity" and it's policy implications. First, notice that countries that implemented austerity just aren't growing as advertised. For example, there's Spain:
Spain admitted on Friday that it would need two extra years to bring its budget deficit back below the EU limit of 3 per cent of gross domestic product, a relaxation of its austerity targets that won tacit approval from Brussels.
.....
The delay reflects the continuing weakness of the credit-starved Spanish economy,
which is set to shrink by another 1.3 per cent this year before
returning to modest growth in 2014. Government finances have been hit
hard by the bursting of Spain’s debt-fuelled housing bubble, which led
to a surge in unemployment and forced Madrid to nationalise a string of troubled banks. Spain has been implementing austerity for a few years now -- and look how much good it's done the country:
That is a track record of success that I'd hang my economic policy hat on.
And then there's the UK -- which just narrowly missed printing a triple dip recession (there's a sign of progress) with a whopping .3% GDP reading in the latest report. Their plan of fiscal consolidation is going so well that .. "The chancellor’s rolling five-year plan to eliminate the underlying deficit, originally intended to achieve its objective by 2016, will be extended until 2018 because of low growth." Where's the stellar growth from austerity?
You can see similar track records all across countries that are implementing austerity.
And her sudden love of Germany is a bit odd. After all, they have and encourage strong labor unions, promote alternative energy and have socialized medicine. They also used fiscal stimulus to limit the effects of the recession Doesn't their success invalidate the majority of her economic theories?
So, a note to Ms. Johnson.
Please make sure you're up-top-date on current economic theory before commenting on economics. Recent developments have invalidated austerity based policy. Your nemesis Paul Krugman is in fact the victor:
For the past five years, a fierce war of words and policies has been fought in America and other economically challenged countries around the world.
On one side were economists and politicians who wanted to increase government spending to offset weakness in the private sector. This "stimulus" spending, economists like Paul Krugman argued, would help reduce unemployment and prop up economic growth until the private sector healed itself and began to spend again.
On the other side were economists and politicians who wanted to cut spending to reduce deficits and "restore confidence." Government stimulus, these folks argued, would only increase debt loads, which were already alarmingly high. If governments did not cut spending, countries would soon cross a deadly debt-to-GDP threshold, after which economic growth would be permanently impaired. The countries would also be beset by hyper-inflation, as bond investors suddenly freaked out and demanded higher interest rates. Once government spending was cut, this theory went, deficits would shrink and "confidence" would return.
.....
The argument is over. Paul Krugman has won. The only question now is whether the folks who have been arguing that we have no choice but to cut government spending while the economy is still weak will be big enough to admit that.
Saturday, April 27, 2013
Weekly Indicators: Railroad red flag edition
- by New Deal democrat
In the rear view window, Q1 GDP was initially reported at +2.5% annualized. Once again, private growth was depressed by government austerity. March monthly data included a sharp decline in durable goods orders, which are now basically flat for a full year. New home sales increased slightly; existing home sales declined slightly. The University of Michigan confidence index increased in the second half of April, but is down month over month.
Let's start this week's look at the high frequency weekly indicators by looking at transports and consumer spending, which are the most significant changes:
Transport
Railroad transport from the AAR
- -5600 or -2.0% carloads YoY
- -1100 or -2.6% carloads ex-coal
- +1400 or +0.6% intermodal units
- -4200 or -0.8% YoY total loads
- Harpex up to 391
- Baltic Dry Index down 17 to 871
Consumer spending
- ICSC +0.8% w/w +1.9% YoY
- Johnson Redbook +1.8% YoY
- Gallup daily consumer spending 14 day average at $91 up $17 YoY
Employment metrics
Initial jobless claims
- 339,000 down 13,000
- 4 week average 357,500 down 3,750
- 92 up 1 w/w, up 1.2% YoY
Daily Treasury Statement tax withholding
- $129.5 B (adjusted for 2013 payroll tax withholding changes) vs. $136.9 B, -5.4% YoY for the last 20 days. The unadjusted result was $150.8 B for a 10.1% increase.
- $139.9 B was collected during the first 19 days of April vs. $129.1 B unadjusted in 2012, a $10.8 B or a +8.3% increase YoY.
Housing metrics
Housing prices
- YoY this week +5.8%
Real estate loans, from the FRB H8 report:
- down 15 or -0.4% w/w
- up 3 or +0.1% YoY
- +2.2% from its bottom
Mortgage applications from the Mortgage Bankers Association:
- +0.3% w/w purchase applications
- +18% YoY purchase applications
- +0.3% w/w refinance applications
Interest rates and credit spreads
- 4.54% BAA corporate bonds down -0.08%
- 1.73% 10 year treasury bonds down -0.06%
- 2.81% credit spread between corporates and treasuries down -0.02%
Money supply
M1
- +2.9% w/w
- +2.3% m/m
- +8.9% YoY Real M1
M2
- +0.4% w/w
- +0.9% m/m
- +5.6% YoY Real M2
Oil prices and usage
- Oil $93.00 up +$4.99 w/w
- Gas $3.54 down -$0.01 w/w
- Usage 4 week average YoY -1.7%
Bank lending rates
- 0.23 TED spread unchanged w/w
- 0.2000 LIBOR unchanged w/w
JoC ECRI Commodity prices
- up 0.25 to 127.12 w/w
- +1.73 YoY
The most significant indicator this week was the negative comparisons from rail loadings, even excluding coal. This was simply a very poor week, and raises a red flag. Temporary jobs, while still positive, are showing deteriorating comparisons YoY. Consumer spending as measured by the ICSC and Johnson Redbook were also quite weak. Gallup consumer spending did remain strongly positive, however.
The positives include housing prices and mortgage applications, gas prices lower than one or two years ago, an improvement in initial jobless claims, and money supply remaining positive. Credit spreads and corporate bond rates also improved.
Basically neutral indicators include shipping rates and overnight banking loans, which haven't budged, and commodities.
Tax withholding remains a question mark. It is negative after my best estimated adjustment, but relative to the last few months, this past week was relatively good.
This remains the same lukewarmly positive data we have seen since the beginning of this year, but rails and consumer spending as measured by same store sales have to be a concern that payroll tax hikes and the Sequester, as well as global weakness, are finally taking a toll. Aside from next Friday's employment report, I will be especially watching the personal savings rate (have consumers exhausted their savings?) and auto sales (will they remain below last November's peak?) in the coming week.
Have a nice weekend.
Friday, April 26, 2013
Democrats lose all leverage in Sequester negotiations
. By New Deal democrat
If you are one of our followers from progressive political blogs, I notice that the crucial point fron this article from Business Insider hasn't been picked up anywhere in the left blogosphere.
According to the article,
This is a massive cave from both Obama and Congressional Democrats on sequestration cuts, giving the party little-to-no leverage to address other cuts to domestic programs.We have three years and nine months to endure of Obama's poker playing skill. G*d help us all.
Notes on GDP: Gandhi's quote works in reverse, too; PS -- Housing's Baaaaaaaack
- by New Deal democrat
It occurred to me during this past week that I hadn't bothered to check for any new iterations of their recession calls by the usual suspects. That, together with the Reinhardt and Rogoff ridicule-a-palooza, caused me to realize that Gandhi's famous quote, "First they ignore you, then they ridicule you, then they fight you, then you win" works just as well to describe enusing events, too: "First you win, then you fight with them, then you ridicule them, then you ignore them" is just as true.
In any event, this morning's report of +2.5% GDP growth in the first quarter of this year is the umpteenth sign that the economy didn't enter recession in summer of 2012 as certain people claimed. Despite the imposition of the 2% increase in payroll taxes at the beginning of January, and despite the onset in March of the Sequester that Washington's Very Serious People claimed was so onerous that it would never be allowed to take effect, the economy still grew.
And while it may be true that neither GDP nor the stock market are valid measures of how the average American is doing, the fact is that I would always prefer a rising GDP and a rising stock market to a declining GDP and/or a declining stock market. The stock market rises because it is anticipated that the economy will continue to grow, and the GDP is evidence that the economy is indeed growing. In other words, the pie is getting bigger. The vast mass of Americans are not going to see their lot improve if the pie is shrinking. A rising GDP is not sufficient for the betterment of most Americans' lot, it is a necessary condition. If the pie is growing, then the question becomes whether the 100,000,000+ American households are meaningfully sharing in that growth.
One year ago, the economy grew at a rate of +2.0%. This morning's news means that the YoY growth in the economy increased from 1.4% to 1.7%. This is simply not an economy that, left to its own devices, is entering a recession.
On the other hand, it remains an economy that is not growing enough. In general, historically have needed +2.0% annual GDP growth to generate reliable job growth. Each 1% growth in the economy above that generates about 1% additional job growth as well, more or less. So here we are, over half a decade after the onset of the "great recession," still running over 5% less than what we need on a population-adjusted basis to return to full employment, and at the paltry rate the economy is growing, it is never going to happen.
And the next recession is already lurking out there somewhere. Maybe somebody should do something?
Bonddad here, chiming in on the GDP report.
There are s few important points from today's report. The first is that consumers are still spending:
Real personal consumption expenditures increased 3.2 percent in the first quarter, compared with an increase of 1.8 percent in the fourth. Durable goods increased 8.1 percent, compared with an increase of 13.6 percent. Nondurable goods increased 1.0 percent, compared with an increase of 0.1 percent. Services increased 3.1 percent, compared with an increase of 0.6 percent.
Those are solid numbers, especially in the durable goods area.
Also consider the strong growth in investment:
Real nonresidential fixed investment increased 2.1 percent in the first quarter, compared with an increase of 13.2 percent in the fourth. Nonresidential structures decreased 0.3 percent, in contrast to an increase of 16.7 percent. Equipment and software increased 3.0 percent, compared with an increase of 11.8 percent. Real residential fixed investment increased 12.6 percent, compared with an increase of 17.6 percent.
Notice that housing investment increased 12.6%, which followed an increase of 17.6% the previous quarter. To that end, consider this chart which shows the percentage change in residential investment from the previous quarter:
Those are impressive numbers over 6 quarters.
Finally, consider this chart which shows the contributions to the percentage change in GDP:
PCEs and investment contributed nicely. We're back to being a net importer -- which actually indicates a strong level of domestic demand.
However, the real culprit here is the decrease caused by government spending.
Austerity is Dead
We've written a fair amount about the absolute, mind-numbing stupidity of austerity on this blog. From the questionable intellectual under-pinnings to the lack of any actual formal evidence in real world application, to the IMF issuing its own mea culpa, it's pretty clear there just wasn't much to the concept in the first place, save for a political philosophy looking for application.
The R&R data fiasco is the nail in the coffin. Simply put, there just isn't anything there anymore. The argument is over and the Keyneseans won.
For the past five years, a fierce war of words and policies has been fought in America and other economically challenged countries around the world.
On one side were economists and politicians who wanted to increase government spending to offset weakness in the private sector. This "stimulus" spending, economists like Paul Krugman argued, would help reduce unemployment and prop up economic growth until the private sector healed itself and began to spend again.
On the other side were economists and politicians who wanted to cut spending to reduce deficits and "restore confidence." Government stimulus, these folks argued, would only increase debt loads, which were already alarmingly high. If governments did not cut spending, countries would soon cross a deadly debt-to-GDP threshold, after which economic growth would be permanently impaired. The countries would also be beset by hyper-inflation, as bond investors suddenly freaked out and demanded higher interest rates. Once government spending was cut, this theory went, deficits would shrink and "confidence" would return.
.....
The argument is over. Paul Krugman has won. The only question now is whether the folks who have been arguing that we have no choice but to cut government spending while the economy is still weak will be big enough to admit that.
Read the whole thing
The R&R data fiasco is the nail in the coffin. Simply put, there just isn't anything there anymore. The argument is over and the Keyneseans won.
For the past five years, a fierce war of words and policies has been fought in America and other economically challenged countries around the world.
On one side were economists and politicians who wanted to increase government spending to offset weakness in the private sector. This "stimulus" spending, economists like Paul Krugman argued, would help reduce unemployment and prop up economic growth until the private sector healed itself and began to spend again.
On the other side were economists and politicians who wanted to cut spending to reduce deficits and "restore confidence." Government stimulus, these folks argued, would only increase debt loads, which were already alarmingly high. If governments did not cut spending, countries would soon cross a deadly debt-to-GDP threshold, after which economic growth would be permanently impaired. The countries would also be beset by hyper-inflation, as bond investors suddenly freaked out and demanded higher interest rates. Once government spending was cut, this theory went, deficits would shrink and "confidence" would return.
.....
The argument is over. Paul Krugman has won. The only question now is whether the folks who have been arguing that we have no choice but to cut government spending while the economy is still weak will be big enough to admit that.
Read the whole thing
Thursday, April 25, 2013
Initial claims and spring seasonality: an update
. - by New Deal democrat
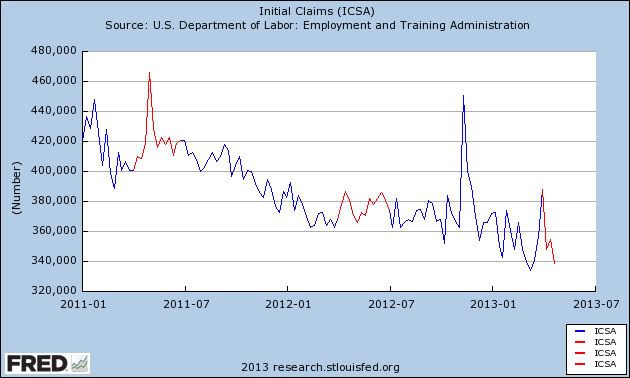
In 2011 and 2012, there appeared to be an unresolved spring seasonality in initial jobless claims. So far this year, the jury is still out.
Here's a graph of initial claims starting with January 2011. The weeks between the last week in March and the end of June are in red:
As of now, the spike in claims for the last week of March looks like a one-time event, although claims haven't gone all the way back to their previous lows. Another couple of weeks should tell if claims retreat or go sideways as they have in the last two years.
Market Analysis: the EU, Pt. II
Earlier this week, Markit released their flash estimates of manufacturing activity. Let's take a look at the readings, starting with the EU as a whole:
The Markit Eurozone PMI® Composite Output Index was unchanged on March’s reading of 46.5 in April, according to the flash estimate. The sub-50
reading indicated a drop in activity for the nineteenth time in the past 20 months, the exception being a marginal increase in January2012.
Activity fell sharply again in both manufacturing and services. While the former saw the steepest rate of decline for four months, the latter saw the downturn
ease slightly compared with March.
The accompanying charts are more telling:
The overall PMI is very telling. Notice that it has been negative since early 2012. And while we saw an increase recently, all the gains associated with the increase have been erased. In short, we're back to weak readings.
Germany -- which was considered somewhat immune to the effects of the EU recession -- has now printed a negative PMI reading. Also notice that France's overall numbers are incredibly weak and have been at weak levels for over a year. Finally, the rest of the EU has been in a contraction for about a year and a half.
The above charts from the same report show break the data into service, manufacturing and composite reading. Notice that both output and new business readings have been in negative territory for about a year and a half.
The Markit Eurozone PMI® Composite Output Index was unchanged on March’s reading of 46.5 in April, according to the flash estimate. The sub-50
reading indicated a drop in activity for the nineteenth time in the past 20 months, the exception being a marginal increase in January2012.
Activity fell sharply again in both manufacturing and services. While the former saw the steepest rate of decline for four months, the latter saw the downturn
ease slightly compared with March.
The accompanying charts are more telling:
The overall PMI is very telling. Notice that it has been negative since early 2012. And while we saw an increase recently, all the gains associated with the increase have been erased. In short, we're back to weak readings.
Germany -- which was considered somewhat immune to the effects of the EU recession -- has now printed a negative PMI reading. Also notice that France's overall numbers are incredibly weak and have been at weak levels for over a year. Finally, the rest of the EU has been in a contraction for about a year and a half.
The above charts from the same report show break the data into service, manufacturing and composite reading. Notice that both output and new business readings have been in negative territory for about a year and a half.
The Massive Underutilization Of The US Workforce
I wanted to return again to Macroblog's employment chart:
I've written a bit about this before, focusing on why businesses aren't hiring. Today I wanted to turn to some macro level numbers that simply show how under-utilized the US labor force is and where that under-utilization is occurring.
Let's start with the standard unemployment rate:
This rate peaked at 10% and has dropped to 7.6%. The rate of this decrease has been painfully slow.
The part-time for economic reasons is defined thusly: This category includes persons who indicated that they would like to work full time but were working part time (1 to 34 hours) because of an economic reason, such as their hours were cut back or they were unable to find full-time jobs.
This number is still far too high. However, it also indicates that employers are cutting back on hours and have been for some time. Along those lines, consider the following chart of total hours worked in the US.
Total hours worked dropped sharply during the recession. Looking in more detail at the last 13 years:
In the previous recession, the lowest that the hours worked index reached was a little below 97.5. After nearly 4 years of expansion, the current recovery is just reaching that level. This indicates that employers were greatly under-utilizaing current employees.
Above is a chart of the average weeks of unemployment (blue line) and the median weeks of unemployment (red line). These statistics show that once you're unemployment, it's likely you'll stay that way for awhile.
Finally, consider the above graph which shows the unemployment rate by educational level. The data couldn't be more clear. Underutilization increases with lesser educational achievement.
As the above data shows, the US labor force is horribly under-utilized right now.
I've written a bit about this before, focusing on why businesses aren't hiring. Today I wanted to turn to some macro level numbers that simply show how under-utilized the US labor force is and where that under-utilization is occurring.
Let's start with the standard unemployment rate:
This rate peaked at 10% and has dropped to 7.6%. The rate of this decrease has been painfully slow.
The part-time for economic reasons is defined thusly: This category includes persons who indicated that they would like to work full time but were working part time (1 to 34 hours) because of an economic reason, such as their hours were cut back or they were unable to find full-time jobs.
This number is still far too high. However, it also indicates that employers are cutting back on hours and have been for some time. Along those lines, consider the following chart of total hours worked in the US.
Total hours worked dropped sharply during the recession. Looking in more detail at the last 13 years:
In the previous recession, the lowest that the hours worked index reached was a little below 97.5. After nearly 4 years of expansion, the current recovery is just reaching that level. This indicates that employers were greatly under-utilizaing current employees.
Above is a chart of the average weeks of unemployment (blue line) and the median weeks of unemployment (red line). These statistics show that once you're unemployment, it's likely you'll stay that way for awhile.
Finally, consider the above graph which shows the unemployment rate by educational level. The data couldn't be more clear. Underutilization increases with lesser educational achievement.
As the above data shows, the US labor force is horribly under-utilized right now.
Wednesday, April 24, 2013
Should the German IFO Chart Be Concerning Us?
On March 27, I posted the chart of the German IFO index with the title, "Should This Chart Be More Concerning?" While the chart is still at decent levels, it has been clearly declining for over two years.
The latest reading shows a continued decline:
The Ifo Business Climate Index for German industry and trade fell in April. Although the majority of companies assessed their current business situation as good, they were far more cautious than last month. Their expectations regarding future business developments were also lower. The German economy is taking a breather.
Here's a chart of the data:
I believe the biggest problem with the above data is the "assessment of business situation" number, which peaked in early/mid-2011 and has been declining since. And while business expectations and IFO climate numbers bumped higher last winter, they both have moved lower recently.
The latest reading shows a continued decline:
The Ifo Business Climate Index for German industry and trade fell in April. Although the majority of companies assessed their current business situation as good, they were far more cautious than last month. Their expectations regarding future business developments were also lower. The German economy is taking a breather.
Here's a chart of the data:
I believe the biggest problem with the above data is the "assessment of business situation" number, which peaked in early/mid-2011 and has been declining since. And while business expectations and IFO climate numbers bumped higher last winter, they both have moved lower recently.
Market Analysis: the EU, Part I
Last week, the ECB issued their monthly bulletin. Let's take a look at the underlying data to reeducate ourselves about the EU.
First, the region has now printed five straight quarters of contraction. If it wasn't for exports (layered blue column at the top), there would be no growth at all. Domestic demand (solid blue) ans contract for five straight quarters and businesses are de-stocking their inventory. From a macro-perspective, there is little good to report on the GDP front.
The overall chart of retail sales shows this number peaked in late 2010 and has been moving lower ever since. The degree of the downturn since late 2010 is similar in intensity to the drop during the great recession, which should lead to a great deal of concern.
According to the latest monthly data, 11 countries saw increases and 11 saw decreases. That report also contained the following
First, notice the different scale -- this chart places sales on a scale of 100 with 2010 = 100. Sales growth more or less stalled in 2009 and started to decrease at the beginning of 2012. Also note that sales stalled around the 100 level for over 2 years. This is not a healthy development at the macro level.
While industrial production was up in the latest report, the overall trend is still negative:
In February 2013 compared with January 2013, seasonally adjusted industrial production1 grew by 0.4% in both the euro area2 (EA17) and the EU272, according to estimates released by Eurostat, the statistical office of the European Union. In January3 production fell by 0.6% and 0.5% respectively.
In February 2013 compared with February 20124, industrial production decreased by 3.1% in the euro area and by 2.5% in the EU27.
Here's a chart of the data:
And finally, there is the overall unemployment rate:
The unemployment rate for the region is at 12% and is clearly in an upward trend.
There's nothing good in any of this data. Period.
First, the region has now printed five straight quarters of contraction. If it wasn't for exports (layered blue column at the top), there would be no growth at all. Domestic demand (solid blue) ans contract for five straight quarters and businesses are de-stocking their inventory. From a macro-perspective, there is little good to report on the GDP front.
The overall chart of retail sales shows this number peaked in late 2010 and has been moving lower ever since. The degree of the downturn since late 2010 is similar in intensity to the drop during the great recession, which should lead to a great deal of concern.
According to the latest monthly data, 11 countries saw increases and 11 saw decreases. That report also contained the following
First, notice the different scale -- this chart places sales on a scale of 100 with 2010 = 100. Sales growth more or less stalled in 2009 and started to decrease at the beginning of 2012. Also note that sales stalled around the 100 level for over 2 years. This is not a healthy development at the macro level.
While industrial production was up in the latest report, the overall trend is still negative:
In February 2013 compared with January 2013, seasonally adjusted industrial production1 grew by 0.4% in both the euro area2 (EA17) and the EU272, according to estimates released by Eurostat, the statistical office of the European Union. In January3 production fell by 0.6% and 0.5% respectively.
In February 2013 compared with February 20124, industrial production decreased by 3.1% in the euro area and by 2.5% in the EU27.
Here's a chart of the data:
And finally, there is the overall unemployment rate:
The unemployment rate for the region is at 12% and is clearly in an upward trend.
There's nothing good in any of this data. Period.
Market Analysis: Canada
I'm fairly bearish on the Canadian economy right now, as I've noted in several posts. Last week, the Canadian Central bank maintained rates at the 1% level. Let's look in more detail at their decision.
The Bank of Canada today announced that it is maintaining its target for the overnight rate at 1 per cent. The Bank Rate is correspondingly 1 1/4 per cent and the deposit rate is 3/4 per cent.
.....
Following a weak second half of 2012, growth in Canada is projected to regain some momentum through 2013 as net exports pick up and business investment returns to more solid growth. Consumer spending is expected to grow at a moderate pace over the projection horizon, while residential investment declines further from historically high levels. Growth in total household credit has slowed and the Bank continues to expect that the household debt-to-income ratio will stabilize near current levels. Despite the projected recovery in exports, they are likely to remain below their pre-recession peak until the second half of 2014 owing to restrained foreign demand and ongoing competitiveness challenges, including the persistent strength of the Canadian dollar.
First, they're projecting overall growth to pick-up in the second half of the year. This statement has been a staple of central bank statements for the duration of this recovery. They have also turned out to be wrong -- or at least far more optimistic they the actual outcomes. And the current slow rate of Canadian growth does not support an increase of the magnitude they're projecting. In addition, exports are a prime reason for this projection. However, the EU is in a slowdown and the US's oil imports from Canada are dropping. Also remember that Canada is experiencing a high household debt scenario right now, which is the same problem the US faced prior to the last recession. Debt-deflation recoveries are notoriously slow and difficult to get out of.
Also consider the following responses from the latest Canadian business survey.
48% of firms reported that sales had dropped over the last 12 months, compared to 31% who said sales increased. This shows a fairly important weakening trend.
However, there are expectations for improvement over the next 12 months.
Canadian firms future optimism is somewhat born out by the above two answers. On the negative side, only 39% are considering increasing their investment in physical plant -- not exactly a ringing endorsement of an anticipated increase in demand. However, 45% are are expecting to increase their hiring over the next 12 months, which adds a bit more heft to their respective future optimism.
Also consider that Canada is a net raw materials exporter -- especially oil. With the US amply supplied and overall demand projected to be weak with the EU recession and Chinese shift to a more consumption based economy, we see further downward pressure on the Canadian economy.
Let's turn to the Canadian Chart.
On the daily chart we see the following:
The Bank of Canada today announced that it is maintaining its target for the overnight rate at 1 per cent. The Bank Rate is correspondingly 1 1/4 per cent and the deposit rate is 3/4 per cent.
.....
Following a weak second half of 2012, growth in Canada is projected to regain some momentum through 2013 as net exports pick up and business investment returns to more solid growth. Consumer spending is expected to grow at a moderate pace over the projection horizon, while residential investment declines further from historically high levels. Growth in total household credit has slowed and the Bank continues to expect that the household debt-to-income ratio will stabilize near current levels. Despite the projected recovery in exports, they are likely to remain below their pre-recession peak until the second half of 2014 owing to restrained foreign demand and ongoing competitiveness challenges, including the persistent strength of the Canadian dollar.
First, they're projecting overall growth to pick-up in the second half of the year. This statement has been a staple of central bank statements for the duration of this recovery. They have also turned out to be wrong -- or at least far more optimistic they the actual outcomes. And the current slow rate of Canadian growth does not support an increase of the magnitude they're projecting. In addition, exports are a prime reason for this projection. However, the EU is in a slowdown and the US's oil imports from Canada are dropping. Also remember that Canada is experiencing a high household debt scenario right now, which is the same problem the US faced prior to the last recession. Debt-deflation recoveries are notoriously slow and difficult to get out of.
Also consider the following responses from the latest Canadian business survey.
48% of firms reported that sales had dropped over the last 12 months, compared to 31% who said sales increased. This shows a fairly important weakening trend.
However, there are expectations for improvement over the next 12 months.
Canadian firms future optimism is somewhat born out by the above two answers. On the negative side, only 39% are considering increasing their investment in physical plant -- not exactly a ringing endorsement of an anticipated increase in demand. However, 45% are are expecting to increase their hiring over the next 12 months, which adds a bit more heft to their respective future optimism.
Also consider that Canada is a net raw materials exporter -- especially oil. With the US amply supplied and overall demand projected to be weak with the EU recession and Chinese shift to a more consumption based economy, we see further downward pressure on the Canadian economy.
Let's turn to the Canadian Chart.
On the daily chart we see the following:
- Prices broke the long-term trend line at the beginning of the month
- All the shorter EMAs are moving lower
- The 10 and 20 day EMA are below the 200 day EMA
- The 50 day EMA is about to cross below the 200 day EMA
- Prices are below the 200 day EMA
- The MACD is declining and is negative
- There is some positive volume in-flow.
Tuesday, April 23, 2013
Market Analysis: Copper
As I noted on April 2, the copper market is weak. In general, we're dealing with a situation of over-supply and diminished demand. Now, with more confirmation that China is indeed slowing, we can expect further weakness in this commodity.
The latest supply information is bearish:
Shipments of refined copper into China in March dropped 37 percent from a year earlier, customs figures showed today. Purchases of previously owned houses slid 0.6 percent to a 4.92 million annual rate last month, figures from the National Association of Realtors showed today. That trailed the 5 million rate projected in a Bloomberg survey of economists.
In the April post, I noted that on the weekly chart, copper had broken technical support of a triangle consolidation pattern. That trend has continued:
The chart above is a weekly copper chart.
Above is a daily copper chart.
The latest supply information is bearish:
Shipments of refined copper into China in March dropped 37 percent from a year earlier, customs figures showed today. Purchases of previously owned houses slid 0.6 percent to a 4.92 million annual rate last month, figures from the National Association of Realtors showed today. That trailed the 5 million rate projected in a Bloomberg survey of economists.
In the April post, I noted that on the weekly chart, copper had broken technical support of a triangle consolidation pattern. That trend has continued:
- The blue arrow is from earlier this month.
- The red arrow shows that prices have continued to move lower.
- All the shorter EMAs are moving lower, with the shortest below the longest
- Prices are below the 200 week EMA
- Momentum is dropping and negative
- the CMF is negative
Above is a daily copper chart.
- The big area of support was at ~41-42. Once prices broke that level, they dropped hard
- Prices are at/near a one year low
- All the shorter EMAs are moving lower, with the shorter below the longer
- Prices are below the 200 day EMA
- Momentum is negative and has given a sell-signal
- The CMF has turned positive, indicating we might be seeing some bottom fishing.
Let's Highlight More Austerity Stupidity
From the Financial Times:
“While this policy is fundamentally right, I think it has reached its limits in many aspects,” Mr Barroso said. “A policy to be successful not only has to be properly designed. It has to have the minimum of political and social support.”
Mr Barroso’s comments come as advocates of the eurozone’s austerity-led crisis response are on the defensive following a voter revolt in Italy, a deepening recession in much of the bloc and the tarnishing of a highly-influential academic treatise arguing high government debt severely hinders economic growth.
Let's look at the above statements.
José
Manuel Barroso said that while he still believed in the need for
sweeping economic reforms and drastic cuts in budget deficits, such
policies needed to have “acceptance, politically and socially”, which
was now at risk.
“While this policy is fundamentally right, I think it has reached its limits in many aspects,” Mr Barroso said. “A policy to be successful not only has to be properly designed. It has to have the minimum of political and social support.”
Mr Barroso’s comments come as advocates of the eurozone’s austerity-led crisis response are on the defensive following a voter revolt in Italy, a deepening recession in much of the bloc and the tarnishing of a highly-influential academic treatise arguing high government debt severely hinders economic growth.
Let's look at the above statements.
- "While this policy is fundamentally right..." No, it's not. In fact, it's fundamentally wrong. Deeply wrong. The UK and Europe have been trying this for a few years now and it's leading to lower growth. As the article goes on to note, Spain, Portugal and Ireland all saw their debt/GDP levels increase last despite implementing austerity policies. This means the data contradicts the statement.
- The deepening recession -- yes, the EU area is in a deep recession. Raise your hand if you have and idea what caused it.
- "A tarnishing of a highly influential academic treatise..." No, it wasn't a tarnishing. It was a complete fuck up on the part of the researchers. They coded the sheet wrong and they made data assumptions that were highly questionable. And -- the policies advocated in the paper have led to a recession. What more information do you actually need?
- We're lacking the political will to do this -- gee, y'think? There's just so much recession I can take before I want some expansion.
Country Analysis: China
Last week's announcement from China that their GDP grew 7.7% year over year was a disappointment for the markets as a whole and a reversal of recent good news:
Gross domestic product rose 7.7 percent from a year earlier, the National Bureau of Statistics said in Beijing today. That compares with the 8 percent median forecast in a Bloomberg News survey of 41 analysts and 7.9 percent in the fourth quarter. March industrial production increased less than estimated while retail-sales growth matched forecasts.
Today’s data add to concerns the global recovery is struggling, with the International Monetary Fund set to lower its forecast for U.S. growth and investor George Soros warning that Germany will probably be in recession by the end of September. Moderating inflation may give new Premier Li Keqiang more room to boost domestic demand as the euro-area debt crisis clouds the outlook for exports.
“The disappointing data show the recovery is much weaker and bumpier than expected, dragged down by soft domestic demand,” said Zhu Haibin, chief China economist at JPMorgan Chase & Co. in Hong Kong. The expansion in credit so far this year may help growth pick up in the second quarter, and authorities may ease efforts to rein in so-called shadow banking while boosting spending in areas including health care and environmental protection, Zhu said.
In addition to the weaker than expected GDP reading, industrial production also printed at a below-expectations level:
In March 2013, the total value added of the industrial enterprises above designated size was up by 8.9 percent year-on-year (the following growth rates of value added are real growth rates, after deducting price factors), 1.0 percentage points lower than that in the first two months of 2013. In March, the total value added of the industrial enterprises above designated size went up by 0.66 percent month-on-month. In the first quarter, the total value added of the industrial enterprises above designated size was up by 9.5 percent.
Here's a chart of the relevant data:
This is the lowest reading in over a year and added to fears that Chinese growth is slowing, which is the consensus sentiment for the current situation:
“I don’t think China will be able to sustain a super-high or ultra-high speed of growth and that is not what we want,” said Xi Jinping, president. “China’s model of development is not sustainable, so it is imperative for us to speed up the transformation of the growth model.”
.....
Echoing
Beijing’s warning, the World Bank on Monday said Chinese growth would
slow to “between 6 and 7 per cent by the end of the decade”, according
to Bert Hofman, its chief Asia economist. In its half-yearly regional
report, the bank said the Chinese economy would expand 8.3 per cent this year, but most analysts believe that forecast is optimistic.
I also this it's very important to put this news is perspective. First, the Chinese economy is not crashing, it's slowing. And it's slowing from a very high rate of growth to a still fast rate of growth. After all, 7.7% Y/O/Y GDP growth is nothing to sneeze at. And there is plenty of good news to report regarding the underlying economy: recent Markit surveys for manufacturing and services are both strong and the Chinese LEIs are rising. However, there is growing evidence that the days of 10% growth are gone, and it is that realization -- that China is no longer the global economic super-powered growth engine -- which drove markets lower last week.
The biggest effect this will have is on commodity export based economies, which have depended on Chinese growth for the last 5-6 years. This means countries like Australia, Chile and Brazil will all be facing slower overall growth. It also means that a strong bid for most commodities is gone. While commodity prices will not be crashing anytime soon, nor will they be bid as strongly as before.
Let's take a look at the Chinese market charts:
Gross domestic product rose 7.7 percent from a year earlier, the National Bureau of Statistics said in Beijing today. That compares with the 8 percent median forecast in a Bloomberg News survey of 41 analysts and 7.9 percent in the fourth quarter. March industrial production increased less than estimated while retail-sales growth matched forecasts.
Today’s data add to concerns the global recovery is struggling, with the International Monetary Fund set to lower its forecast for U.S. growth and investor George Soros warning that Germany will probably be in recession by the end of September. Moderating inflation may give new Premier Li Keqiang more room to boost domestic demand as the euro-area debt crisis clouds the outlook for exports.
“The disappointing data show the recovery is much weaker and bumpier than expected, dragged down by soft domestic demand,” said Zhu Haibin, chief China economist at JPMorgan Chase & Co. in Hong Kong. The expansion in credit so far this year may help growth pick up in the second quarter, and authorities may ease efforts to rein in so-called shadow banking while boosting spending in areas including health care and environmental protection, Zhu said.
In addition to the weaker than expected GDP reading, industrial production also printed at a below-expectations level:
In March 2013, the total value added of the industrial enterprises above designated size was up by 8.9 percent year-on-year (the following growth rates of value added are real growth rates, after deducting price factors), 1.0 percentage points lower than that in the first two months of 2013. In March, the total value added of the industrial enterprises above designated size went up by 0.66 percent month-on-month. In the first quarter, the total value added of the industrial enterprises above designated size was up by 9.5 percent.
Here's a chart of the relevant data:
This is the lowest reading in over a year and added to fears that Chinese growth is slowing, which is the consensus sentiment for the current situation:
“I don’t think China will be able to sustain a super-high or ultra-high speed of growth and that is not what we want,” said Xi Jinping, president. “China’s model of development is not sustainable, so it is imperative for us to speed up the transformation of the growth model.”
.....
I also this it's very important to put this news is perspective. First, the Chinese economy is not crashing, it's slowing. And it's slowing from a very high rate of growth to a still fast rate of growth. After all, 7.7% Y/O/Y GDP growth is nothing to sneeze at. And there is plenty of good news to report regarding the underlying economy: recent Markit surveys for manufacturing and services are both strong and the Chinese LEIs are rising. However, there is growing evidence that the days of 10% growth are gone, and it is that realization -- that China is no longer the global economic super-powered growth engine -- which drove markets lower last week.
The biggest effect this will have is on commodity export based economies, which have depended on Chinese growth for the last 5-6 years. This means countries like Australia, Chile and Brazil will all be facing slower overall growth. It also means that a strong bid for most commodities is gone. While commodity prices will not be crashing anytime soon, nor will they be bid as strongly as before.
Let's take a look at the Chinese market charts:
- Prices are trading in the lower third of their band for the last three years.
- Prices are contained by the 61.8% Fib level established from the high of October 2020 and low of November 2012.
- The 2450-2480 level has strong resistance for the average
- Prices are also contained by the 200 week EMA
- While the MACD is rising, it has only recently turned positive
- The shorter EMAs (10, 20 and 50 week) are tangled, indicating no meaningful direction either way
- At the beginning of the year, the market formed a head and shoulders topping formation which I noted on March 12
Is the Chinese market forming a short-term head and shoulders top? twitter.com/captivelawyer/…
— Hale Stewart/Bonddad (@captivelawyer) March 12, 2013- Prices have been descending from an early November peak of 2443 in a disciplined downward sloping channel.
- Prices are currently right at the 200 day EMA.
- The shorter EMAs are moving lower
- Momentum is negative and dropping.
Monday, April 22, 2013
Economics as philosophy with calculus: an example
- by New Deal democrat
No sooner does Bonddad publish his piece immediately below than Paul Krugman finds a nearly perfect example of my critique last week of much of economics as merely "Philosophy with Calculus," i.e., data and results that don't fit the already-held ideology are ignored. He quotes Anders Asland's assertion that "Reinhart and Rogoff are still right" because their work provided:
an important corrective to the view that fiscal stimulus is always right - a position ... led by Paul Krugman....Krugman notes that he's never said that stimulus is "always right," but more fundamentally in my view is the fact that to Asland, the ideological conclusion is obviously right, the evidence be damned. If the data doesn't matter, than it is simply highfalutin math in service of philosophy, and not science at all.
P.S.: I'm not saying that all macroeconomics is not science. Both Krugman and Brad DeLong, for example, have confessed to errors in their previously held beliefs that were shown to be false by subsequent data. But if I'm an astronomer and half my profession turns out to be astrologers, or if I'm a metallurgist and half my profession turns out to be alchemists, then my profession has a problem.
Why Does Anyone Listen To Conservative Economists Anymore?
Last week, we learned that the Reinhart and Rogoff paper which
provided one of the strongest pedestals for the austerity debate was
deeply flawed. Mike Konczal at the Next New Deal summarizes the basic
problems here. Several other people added their commentary (see Dean Baker, Paul Krugman and Marginal Revolution). In addition, the IMF issued a paper in 2011
wherein they recognize that austerity -- especially in a time of
economic weakness -- is bad policy. We also have actual evidence from
Europe and the UK that austerity does not work.
But just as importantly, an entire branch of economic thought has been wrong for the entire post recession period. Starting in 2008 with the Fed's QE program, we were told that we'd see hyper-inflation and rising interest rates. In fact, we've seen the exact opposite in countries that implemented these policies. (Oddly enough, we are seeing inflationary pressures in countries with high interest rates (India and Brazil being prime examples). We've also been told that the dollar would collapse, when in fact the dollar has become a safe haven currency. In short, literally every single prediction and prognostication made by conservative economic thought over the last four years has been wrong, leading to this question: why are we still listening to them?
Let's start with the Art Laffer WSJ editorial wherein he predicted that expansionary austerity would lead to hyper inflation. He made this prediction in the Wall Street Journal on June 11, 2009. He noted that there had been a huge expansion in the monetary base as a result of QE and that this explosion would lead to hyperinflation. Invictus (from the Big Picture Blog) and I responded to this prognostication in an article on the Huffington Post, where we argued that while bank reserves had increased there was no transmission mechanism for those reserves to enter the economy. Excess reserves would lead to inflation if consumers took out the requisite number of loans. But in an economy that is de-leveraging, loan demand is nil. Four years later, Art Laffer's predictions are, well, laughable.
But Laffer is not the only economist who's been wrong about inflation. John Cochrane of the University of Chicago was also concerned about inflation in a post on his blog on June 12, 2012, where he wrote:
The Federal Government has about $15 trillion of formal Federal debt outstanding. It has uncountable trillions more unfunded promises and credit guarantees. Right now it takes in about $1.5 trillion and spends about $3 trillion a year.
We must, by arithmetic, either pay off this debt, default on it, or inflate it away. Which will we do?
I hope we pay it off. The only hope for paying it off is to return promptly to strong long-run growth, and to reform entitlements. Doubling Federal revenues by raising income tax rates on "the rich," or by cutting discretionary spending by more than $1.5 trillion per year, forever, seem unlikely. That's arithmetic too.
Notice that in the same post he says inflation's a danger not a prediction. Yet, at that time QE was in play for three years. And we're nearly a year after that statement from him with no inflationary pressures.
Notice that neither Laffer nor Cochrane have changed their minds or offered any mea culpa's regarding their statements.
John Taylor of Stanford holds a PhD. Yet he has continually compared this recovery to the early 1980s recovery. As I noted on May 3rd of last year, this comparison was ill-founded for several important reasons. The early 1980s recession was caused by the Fed increasing interest rates to kill inflation whereas this recession was caused by the popping of an asset bubble. Additionally, we have a massive debt overhang which means overall demand spending is low. He has recently issued a paper arguing for a massive budget consolidation over a 10 year period despite the clear evidence from the EU, UK and the IMF's updated research that this would be a very bad policy.
And finally, there is Mish, who in spite of the deep flaws in the R&R research still clings to his beliefs. However, now he's bolstering them with the Treasury View:
Empirical studies cannot be used to settle points about economic theory. It should be obvious that deficit spending is nothing but deferred taxation. And obviously, since government spending has no concept of the categories of profit and loss, such spending is typically a mindless waste of scarce resources. No bureaucracy has any inkling of opportunity costs or consumer wishes. The spenders are saying: government bureaucrats know better how to allocate resources than the private sector. Perhaps, but certainly not in this universe.
Here's the bottom line with all of the above individuals. While they've all proven themselves to be highly educated individuals with impressive credentials, they all share another, less-flattering common trait: they've all be universally wrong in their predictions and prognostications regarding the current recovery. As NDD pointed out on Thursday, this makes their basic profession a philosophy, not a science. In most other disciplines, this record of inaccuracy would mean their advice was no longer sought. However, they still have an audience and, most importantly, still exert an influence over policy proscriptions. The money question is now, "why are people seeking this advice when they have been this wrong?"
But just as importantly, an entire branch of economic thought has been wrong for the entire post recession period. Starting in 2008 with the Fed's QE program, we were told that we'd see hyper-inflation and rising interest rates. In fact, we've seen the exact opposite in countries that implemented these policies. (Oddly enough, we are seeing inflationary pressures in countries with high interest rates (India and Brazil being prime examples). We've also been told that the dollar would collapse, when in fact the dollar has become a safe haven currency. In short, literally every single prediction and prognostication made by conservative economic thought over the last four years has been wrong, leading to this question: why are we still listening to them?
Let's start with the Art Laffer WSJ editorial wherein he predicted that expansionary austerity would lead to hyper inflation. He made this prediction in the Wall Street Journal on June 11, 2009. He noted that there had been a huge expansion in the monetary base as a result of QE and that this explosion would lead to hyperinflation. Invictus (from the Big Picture Blog) and I responded to this prognostication in an article on the Huffington Post, where we argued that while bank reserves had increased there was no transmission mechanism for those reserves to enter the economy. Excess reserves would lead to inflation if consumers took out the requisite number of loans. But in an economy that is de-leveraging, loan demand is nil. Four years later, Art Laffer's predictions are, well, laughable.
But Laffer is not the only economist who's been wrong about inflation. John Cochrane of the University of Chicago was also concerned about inflation in a post on his blog on June 12, 2012, where he wrote:
The Federal Government has about $15 trillion of formal Federal debt outstanding. It has uncountable trillions more unfunded promises and credit guarantees. Right now it takes in about $1.5 trillion and spends about $3 trillion a year.
We must, by arithmetic, either pay off this debt, default on it, or inflate it away. Which will we do?
I hope we pay it off. The only hope for paying it off is to return promptly to strong long-run growth, and to reform entitlements. Doubling Federal revenues by raising income tax rates on "the rich," or by cutting discretionary spending by more than $1.5 trillion per year, forever, seem unlikely. That's arithmetic too.
Notice that in the same post he says inflation's a danger not a prediction. Yet, at that time QE was in play for three years. And we're nearly a year after that statement from him with no inflationary pressures.
Notice that neither Laffer nor Cochrane have changed their minds or offered any mea culpa's regarding their statements.
John Taylor of Stanford holds a PhD. Yet he has continually compared this recovery to the early 1980s recovery. As I noted on May 3rd of last year, this comparison was ill-founded for several important reasons. The early 1980s recession was caused by the Fed increasing interest rates to kill inflation whereas this recession was caused by the popping of an asset bubble. Additionally, we have a massive debt overhang which means overall demand spending is low. He has recently issued a paper arguing for a massive budget consolidation over a 10 year period despite the clear evidence from the EU, UK and the IMF's updated research that this would be a very bad policy.
And finally, there is Mish, who in spite of the deep flaws in the R&R research still clings to his beliefs. However, now he's bolstering them with the Treasury View:
Empirical studies cannot be used to settle points about economic theory. It should be obvious that deficit spending is nothing but deferred taxation. And obviously, since government spending has no concept of the categories of profit and loss, such spending is typically a mindless waste of scarce resources. No bureaucracy has any inkling of opportunity costs or consumer wishes. The spenders are saying: government bureaucrats know better how to allocate resources than the private sector. Perhaps, but certainly not in this universe.
Here's the bottom line with all of the above individuals. While they've all proven themselves to be highly educated individuals with impressive credentials, they all share another, less-flattering common trait: they've all be universally wrong in their predictions and prognostications regarding the current recovery. As NDD pointed out on Thursday, this makes their basic profession a philosophy, not a science. In most other disciplines, this record of inaccuracy would mean their advice was no longer sought. However, they still have an audience and, most importantly, still exert an influence over policy proscriptions. The money question is now, "why are people seeking this advice when they have been this wrong?"
Market Analysis: US
The top chart is a 60 minute chart of the SPYs.
- Prices have moved in a downward sloping channel from the 159 to 154 level since April 12.
- After hitting 154 we see prices move higher into the 200 minute EMA.
- Momentum has shifted giving a positive signal, but the indicator is still negative
- a disciplined sell-off forming a downward sloping pennant pattern
- the 50 day EMA is currently providing support.
- Prices have broken the support of the trend line connecting the late December 2012 and February 2013 lows.
- The MACD is weakening, although still positive.
- We see an increase in volume on the most recent sell-off
The daily QQQ shows the following
- Prices have broken the trend line of the mid-November, late-December and late February lows for a second time.
- The most recent trend break has been by a solid candle on higher volume
- Prices have also broken the 50 day EMA
- Momentum is weak
- The MACD has given a sell signal
On the daily IWM, notice the following:
- The MACD has been weakening since February
- The MACD is now in negative territory
- The CMF is very weak
- Prices have hit the 94.5-95 level twice, only to be rebuffed.
- Prices are below all the shorter EMAs
- The 10 day EMA is about to cross below the 50 day EMA
- Prices are using the top Fib fan for technical support
Sunday, April 21, 2013
Weekly indicators: return to lukewarm positive edition
- by New Deal democrat
Monthly data releases for March in the last week included Leading Economic INdicatorss, down -0.1, the first decline in half a year. These in turn were influenced by a decline in housing permits. Housing starts, on the other hand, rose to over 1 million annualized for the first time in over 5 years. Industrial production and caparicty utilizstion rose. Consumer prices in March actually declined slightly, led by a drop in gasoline prices.
Let's start this week's look at the high frequency weekly indicators by looking at employment data, which completely flipped this week vs. last week:
Employment metrics
Initial jobless claims
- 352,000 up 6,000
- 4 week average 361,250 up 3,250
- flat at 91 w/w up 1.5% YoY
Initial claims have established a new lower range of between 330,000 to 375,000 this year. In the last two years, beginning at the end of the first quarter there has been a spike of 20,000+ in jobless applications, and we certainly did see a big increase two weeks ago for one week. As in the past two springs, we now seem to be moving sideways in the new range. The ASA is still running slighty below 2007, and slightly ahead of last year, although the comparison is deteriorating a small amount.
Daily Treasury Statement tax withholding
- $131.1 B (adjusted for 2013 payroll tax withholding changes) vs. $138.2 B, -5.1% YoY for the last 20 days. The unadjusted result was $152.6 B for a 10.4% increase.
- $111.1 B was collected during the first 14 days of April vs. $103.6 B unadjusted in 2012, a $7.5 B or a +7.2% increase YoY.
Transport
Railroad transport from the AAR
- -1600 or -0.6% carloads YoY
- +1300 or +0.7% carloads ex-coal
- +7700 or +3.3% intermodal units
- +6100 or +1.2% YoY total loads
- Harpex unchanged at 384
- Baltic Dry Index up 13 to 888
Consumer spending
- ICSC -1.1% w/w +2.0% YoY
- Johnson Redbook +2.0%YoY
- Gallup daily consumer spending 14 day average at $86 up $12 YoY
Housing metrics
Housing prices
- YoY this week +5.6%
Real estate loans, from the FRB H8 report:
- up 6 or +0.2% w/w
- up 22 or +0.6% YoY
- +2.6% from its bottom
Mortgage applications from the Mortgage Bankers Association:
- +4% w/w purchase applications
- +20% YoY purchase applications
- +5% w/w refinance applications
Interest rates and credit spreads
- 4.62% BAA corporate bonds down -0.08%
- 1.79% 10 year treasury bonds down -0.02%
- 2.83% credit spread between corporates and treasuries down -0.06%
Money supply
M1
- -2.7% w/w
- +1.1% m/m
- +9.0% YoY Real M1
M2
- -0.3% w/w
- +0.9% m/m
- +5.5% YoY Real M2
Oil prices and usage
- Oil $88.01 down -$3.47 w/w
- gas $3.54 down -$0.07 w/w
- Usage 4 week average YoY -3.4%
Bank lending rates
- 0.23 TED spread up .01 w/w
- 0.2000 LIBOR unchanged w/w
JoC ECRI Commodity prices
- down -1.58 to 126.87 w/w
- +3.73 YoY
The positives include housing prices and mortgage applications, gas prices lower than one or two years ago, and money supply remaining positive, although less so than previously. Consumer spending is positive. Rail turned positive as well. Real estate loans improved, as did credit spreads.
Basically neutral indicators include shipping rates, interest rates and temporary jobs. Overnight banking loans haven't budged. Initial claims were generally neutral this week.
Tax withholding remains a question mark. It is negative after my best estimated adjustment. But relative to the last few months, this past week was one of the most positive comparisons. Commodities, although positive YoY, have weakened recently.
Overall, this is the same lukewarmly positive data we have seen since the beginning of this year. Have a nice weekend.
Subscribe to:
Posts (Atom)