Gross domestic product rose 7.7 percent from a year earlier, the National Bureau of Statistics said in Beijing today. That compares with the 8 percent median forecast in a Bloomberg News survey of 41 analysts and 7.9 percent in the fourth quarter. March industrial production increased less than estimated while retail-sales growth matched forecasts.
Today’s data add to concerns the global recovery is struggling, with the International Monetary Fund set to lower its forecast for U.S. growth and investor George Soros warning that Germany will probably be in recession by the end of September. Moderating inflation may give new Premier Li Keqiang more room to boost domestic demand as the euro-area debt crisis clouds the outlook for exports.
“The disappointing data show the recovery is much weaker and bumpier than expected, dragged down by soft domestic demand,” said Zhu Haibin, chief China economist at JPMorgan Chase & Co. in Hong Kong. The expansion in credit so far this year may help growth pick up in the second quarter, and authorities may ease efforts to rein in so-called shadow banking while boosting spending in areas including health care and environmental protection, Zhu said.
In addition to the weaker than expected GDP reading, industrial production also printed at a below-expectations level:
In March 2013, the total value added of the industrial enterprises above designated size was up by 8.9 percent year-on-year (the following growth rates of value added are real growth rates, after deducting price factors), 1.0 percentage points lower than that in the first two months of 2013. In March, the total value added of the industrial enterprises above designated size went up by 0.66 percent month-on-month. In the first quarter, the total value added of the industrial enterprises above designated size was up by 9.5 percent.
Here's a chart of the relevant data:
This is the lowest reading in over a year and added to fears that Chinese growth is slowing, which is the consensus sentiment for the current situation:
“I don’t think China will be able to sustain a super-high or ultra-high speed of growth and that is not what we want,” said Xi Jinping, president. “China’s model of development is not sustainable, so it is imperative for us to speed up the transformation of the growth model.”
.....
Echoing Beijing’s warning, the World Bank on Monday said Chinese growth would slow to “between 6 and 7 per cent by the end of the decade”, according to Bert Hofman, its chief Asia economist. In its half-yearly regional report, the bank said the Chinese economy would expand 8.3 per cent this year, but most analysts believe that forecast is optimistic.
I also this it's very important to put this news is perspective. First, the Chinese economy is not crashing, it's slowing. And it's slowing from a very high rate of growth to a still fast rate of growth. After all, 7.7% Y/O/Y GDP growth is nothing to sneeze at. And there is plenty of good news to report regarding the underlying economy: recent Markit surveys for manufacturing and services are both strong and the Chinese LEIs are rising. However, there is growing evidence that the days of 10% growth are gone, and it is that realization -- that China is no longer the global economic super-powered growth engine -- which drove markets lower last week.
The biggest effect this will have is on commodity export based economies, which have depended on Chinese growth for the last 5-6 years. This means countries like Australia, Chile and Brazil will all be facing slower overall growth. It also means that a strong bid for most commodities is gone. While commodity prices will not be crashing anytime soon, nor will they be bid as strongly as before.
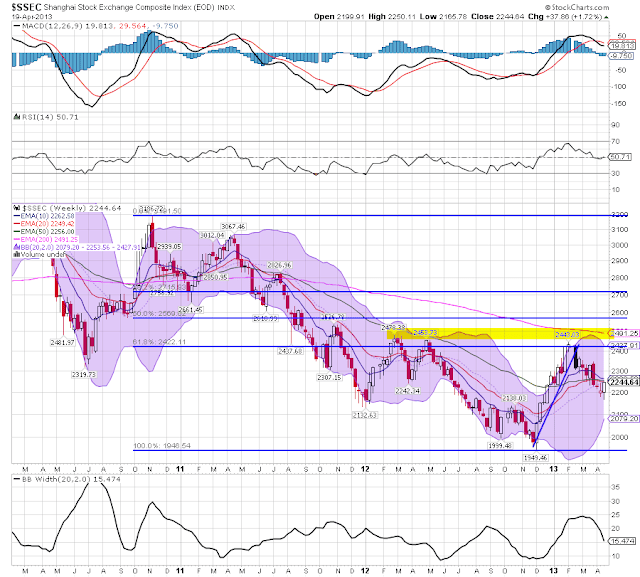
Let's take a look at the Chinese market charts:
- Prices are trading in the lower third of their band for the last three years.
- Prices are contained by the 61.8% Fib level established from the high of October 2020 and low of November 2012.
- The 2450-2480 level has strong resistance for the average
- Prices are also contained by the 200 week EMA
- While the MACD is rising, it has only recently turned positive
- The shorter EMAs (10, 20 and 50 week) are tangled, indicating no meaningful direction either way
- At the beginning of the year, the market formed a head and shoulders topping formation which I noted on March 12
Is the Chinese market forming a short-term head and shoulders top? twitter.com/captivelawyer/…
— Hale Stewart/Bonddad (@captivelawyer) March 12, 2013- Prices have been descending from an early November peak of 2443 in a disciplined downward sloping channel.
- Prices are currently right at the 200 day EMA.
- The shorter EMAs are moving lower
- Momentum is negative and dropping.


