Saturday, November 10, 2007

Some Long Term Perspective

After big sell-offs, its usually a good idea to take a look at the long-term market perspective to see exactly where we are in the market cycle.

Also a note about my charts. I'm playing with different chart formats. After reading Tim Knight's blog Slope of Hope I'm trying out a longer chart using log scale. I'm not sure if I will continue to use it, but it does seem to show price movements in a clearer way.
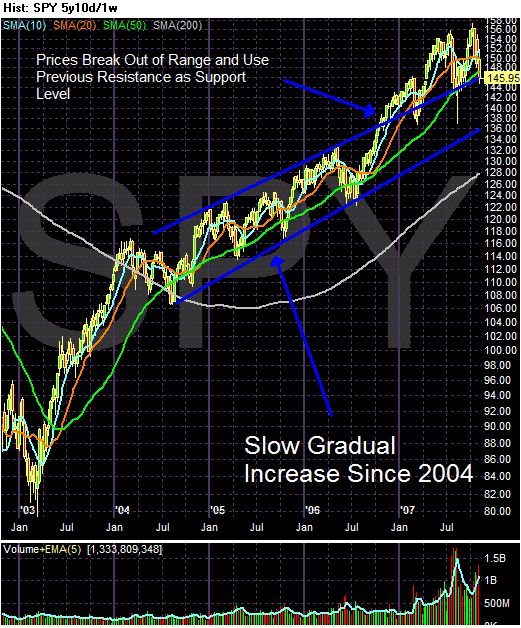


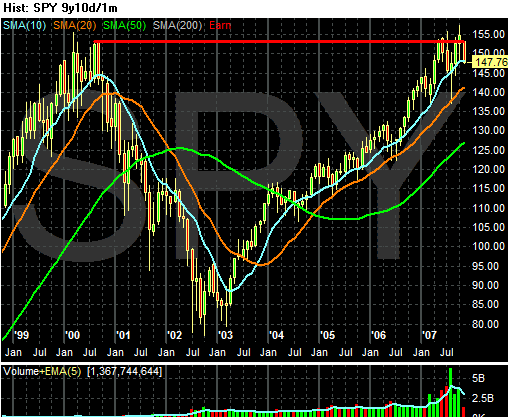
The SPYs were in a three year uptrend which they broke out of in late 2006. They have rallied from previous resistance levels twice. There are two ways to look at the two tops formed in 2007. One is as part of an increasing highs/increasing lows rallying formation. The other is as a double top. The highs are within two points of each other, so a double top seems the more likely explanation; the second top isn't meaningfully higher than the first.
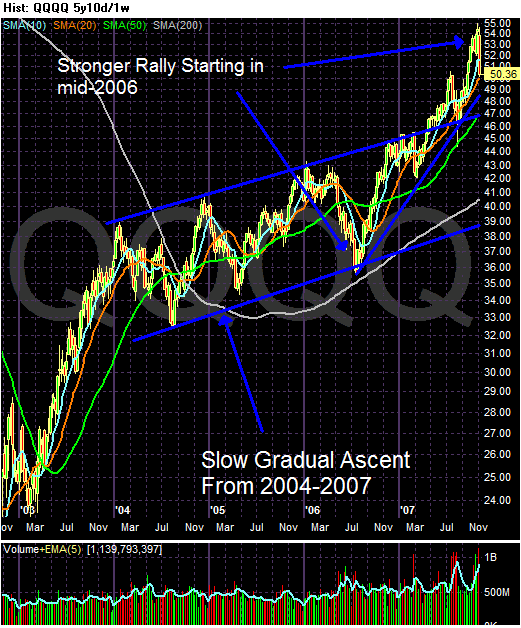


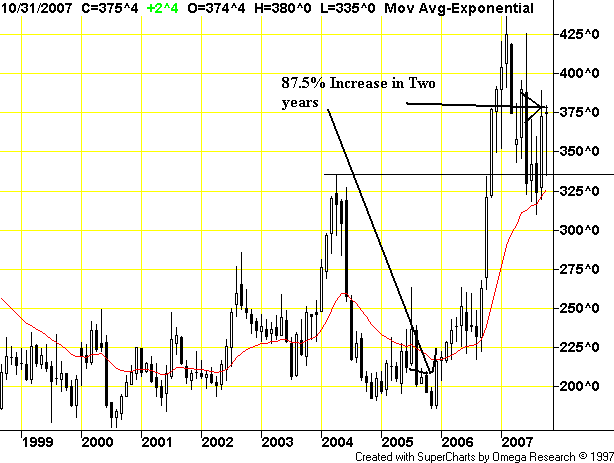
Like the SPYs, the QQQQs were in the middle of a three year uptrend starting in 2004. However, starting in mid-2006, the QQQQs went into another pattern -- an upward sloping rally. They are still in the middle of this rally; in fact, the QQQQs have two levels of long-term support. The first is the upper range of the 2004-2007 rally. The second is the support of the upward sloping rally that started in 2006.
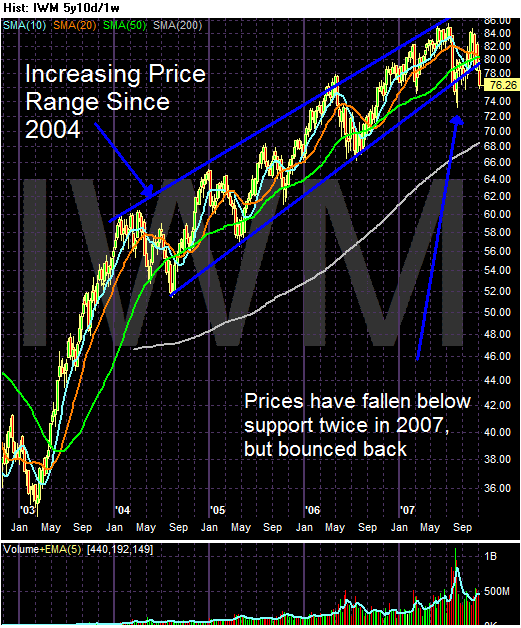


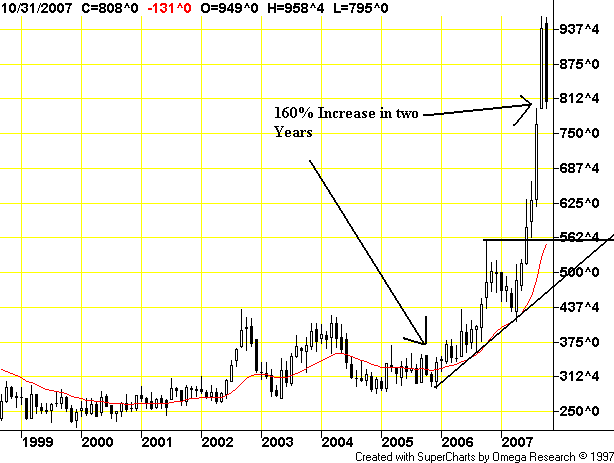
The Russel 2000 is at the lower end of a four year uptrend. This is a crucial market to watch over the next few weeks. The Russell 2000 is an index of small cap stocks. As such, it's appropriate to consider this index a measure of traders overall risk appetite. In addition, the index is currently testing the lows of its three year upward move. A decisive move below support would signal a change in traders risk appetite. In other words, in a more pronounced market correction the first stocks to get hit are the riskiest. This is what the Russell 2000 tracks.

Friday, November 9, 2007

Weekend Weimar

Traffic has increased this week, which I am guessing is part of the market turmoil we have been experiencing this week. So to my new readers, welcome to "Weekend Weimar". I have two -- Kate and Sarg -- who are great dogs. This is a great breed, full of personality and spirit. I like them best because they have strong issues with authority (I have no idea why I like that...)

When you see these pictures, you know the following.

1.) The markets are closed.

2.) It's time to take a break.

I will post more charts and graphs on the market tomorrow and Sunday. But for now, take a break. Take a walk, go running, read a book, play guitar, watch a movie, or do anything except think about the economy and the markets.

What Inflation?

From the BLS:

The U.S. Import Price Index advanced 1.8 percent in October, the Bureau of Labor Statistics of the U.S. Department of Labor reported today, led by a 6.9 percent rise in petroleum prices. The increase followed a 0.8 percent advance in September. Prices for U.S. exports rose 0.9 percent in October after a 0.3 percent increase the previous month.

....

The 1.8 percent rise in import prices in October was the largest monthly increase since a similar change in May 2006. The advance followed a 0.8 percent rise in September as the increase during the past two months continued the upward trend over most of 2007 after a 0.4 percent downturn in August. The 6.9 percent increase in petroleum prices was the largest contributor to the October increase, although nonpetroleum prices also advanced, rising 0.5 percent. Petroleum prices continued an upward trend over the past year, rising 41.4 percent for the 12 months ended in October. The increase in nonpetroleum prices in October followed a 0.2 percent decline in September. Nonpetroleum prices advanced 3.2 percent over the past year while the price index for overall imports rose 9.6 percent for the same period.


Here's how the Federal Reserve reads this statement:


The U.S. Import Price Index advanced 1.8 percent in October, the Bureau of Labor Statistics of the U.S. Department of Labor reported today, led by a 6.9 percent rise in petroleum prices. The increase followed a 0.8 percent advance in September. Prices for U.S. exports rose 0.9 percent in October after a 0.3 percent increase the previous month.

....

The 1.8 percent rise in import prices in October was the largest monthly increase since a similar change in May 2006. The advance followed a 0.8 percent rise in September as the increase during the past two months continued the upward trend over most of 2007 after a 0.4 percent downturn in August. The 6.9 percent increase in petroleum prices was the largest contributor to the October increase, although nonpetroleum prices also advanced, rising 0.5 percent. Petroleum prices continued an upward trend over the past year, rising 41.4 percent for the 12 months ended in October. The increase in nonpetroleum prices in October followed a 0.2 percent decline in September. Nonpetroleum prices advanced 3.2 percent over the past year while the price index for overall imports rose 9.6 percent for the same period.


Wasn't that easy? All of the bad news is gone.

Get Ready For More Downgrades

From the WSJ:

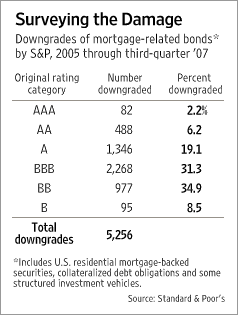
In the next few weeks, debt-rating services like Moody's Investors Service, Standard & Poor's and Fitch Ratings look poised to downgrade hundreds of mortgage-related investments worth tens of billions of dollars, creating the potential for more market unrest.

....

Credit-rating firms have lowered their credit ratings on more than $70 billion in mortgage-related bonds in the past few months, setting off waves of distress in the stock and bond markets. They've also expressed concerns about the outlook for a range of related industries from banking to bond insurance. Banks and Wall Street firms including Citigroup Inc. and Merrill Lynch & Co. took large charges when they were forced to reassess the value of even their highest-rated mortgage debt.


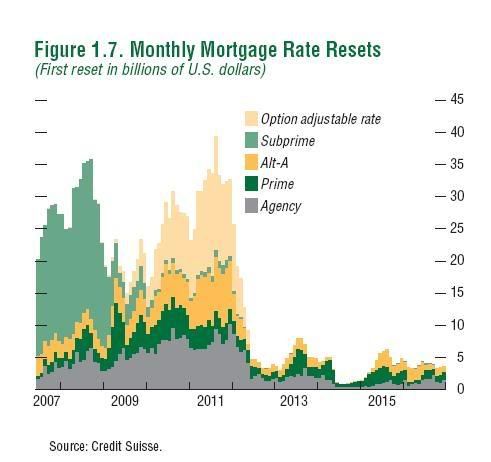
The article also has this very revealing graphic about the breadth of the writedowns:


This is going to get really ugly and confusing for money managers over the next year or so as they figure out what they can and can't invest in.

Thursday, November 8, 2007

A Closer Look At the Financial Sector

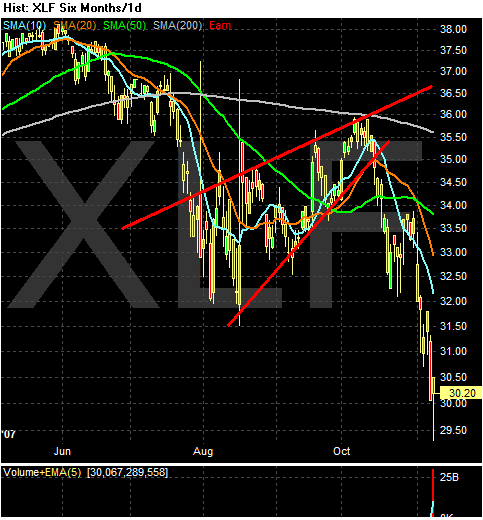
About a month ago I looked at the various sectors withing the financial sector. In light of yesterday's bank inspired rally, I want to look at the XLF and its largest components.

Here is what got me thinking about this sector:

``More people are going to start nibbling in the financials because they've been in a bear market more or less for the last six months,'' said Joseph Quinlan, chief market strategist for Bank of America Corp.'s Global Wealth & Investment Management unit, which oversees $710 billion. ``The correction has been severe enough that now we've gotten buyers back into the market.''


The XLF


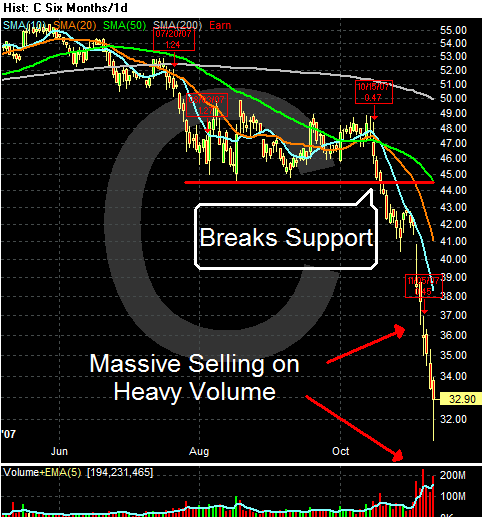
Citigroup


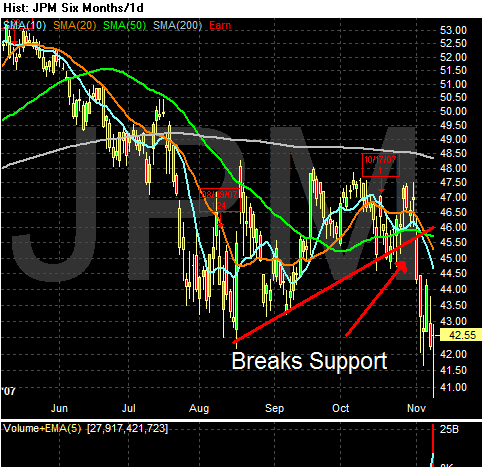
JP Morgan


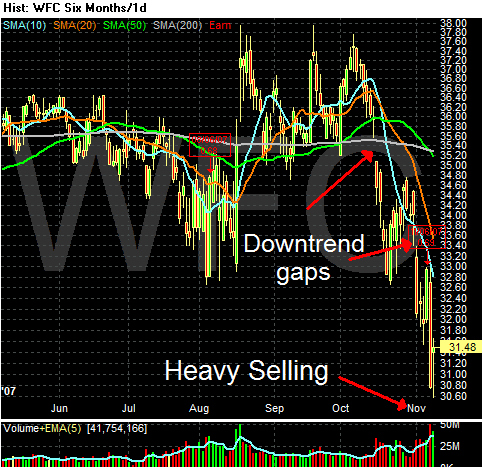
Wells Fargo


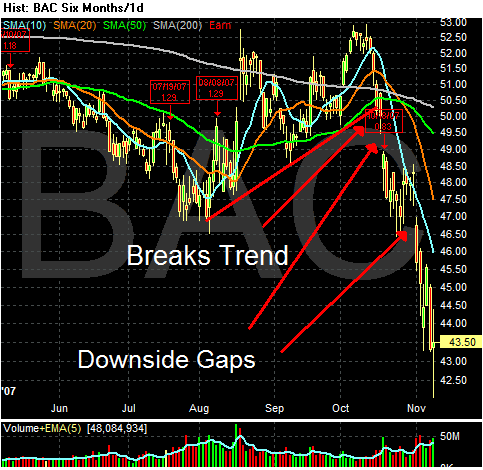
Bank of America


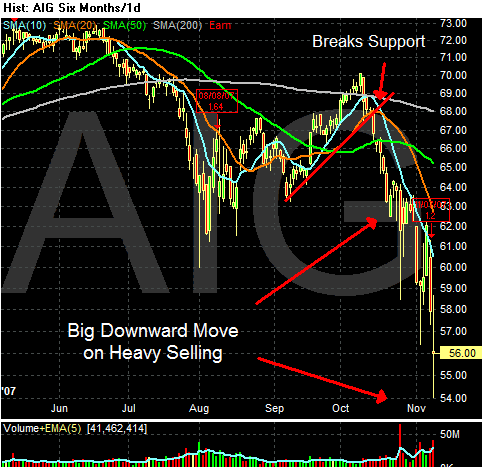
AIG


My commentary to all the charts is the same.

1.) All are below the 200 day simple moving average (SMA). This is bear market territory.

2.) All of their respective SMAs are moving lower.

3.) All of their respective prices are below their SMAs.

4.) All have recently broken key technical support.

5.) Most of their shorter SMAs are below longer term SMAs, indicating further downward price pressure.

6.) Some of the chart have downside price gaps, indicating extreme selling pressure.

The bottom line is simple: this sector says either sell me or stay the hell away. This is not the time to be buying financial shares in any way, shape or form.

Like Lemmings Off a Cliff....

From Bloomberg:

Most U.S. stocks rose after banks rallied in the final hour of trading from their lowest level in two years and food companies climbed on speculation their earnings growth will weather a slowing economy.

...

``All of a sudden these things are starting to get pretty cheap,''
said Wayne Wilbanks, who oversees $1.3 billion as chief investment officer of Wilbanks Smith & Thomas Asset Management LLC in Norfolk, Virginia. ``That's what was important about today. This was a good sign.''


Let's define cheap in a few ways.

1.) Cheap because it is overlooked.

2.) Cheap because it sucks.
Which category does the industry that today alone wrote down over $10 billion in debt fall into?

In case you're wondering, we're a few years off from the end of this problem


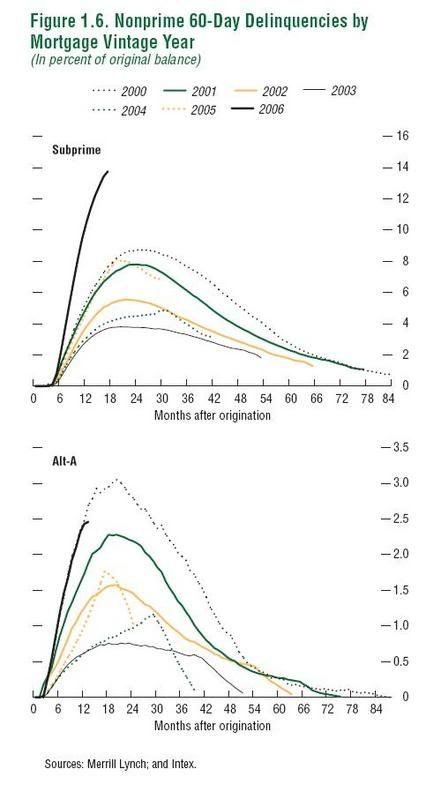
Then there's the whole delinquency thing....


Financials are cheap because they suck right now.

Today's Markets


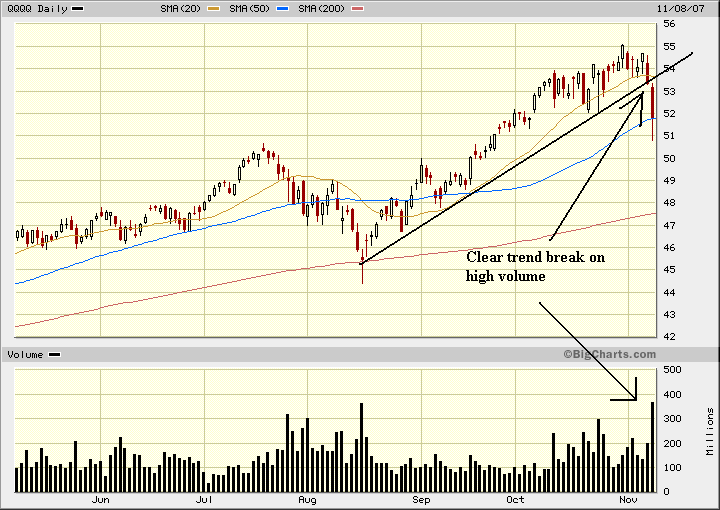
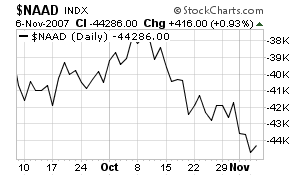
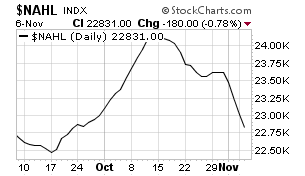
I'm going to start with the QQQQ's daily chart, because this is where the real news of the day lies. For the last few weeks, tech has been the market's saving grace. That stopped today as trader's booked profits. The problem with the NASDAQ has been an ever decreasing breadth. Here are the breadth charts that I put up yesterday that show a decreasing level of participation from issues in the index.

Cumulative advance/decline line


New highs/new lows.


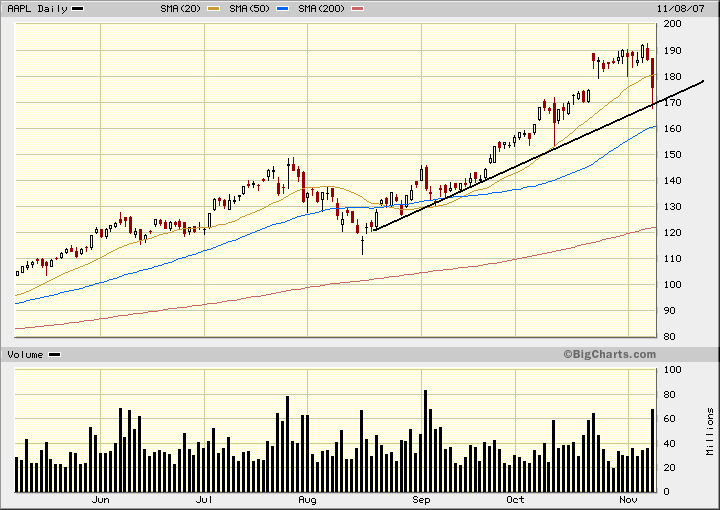
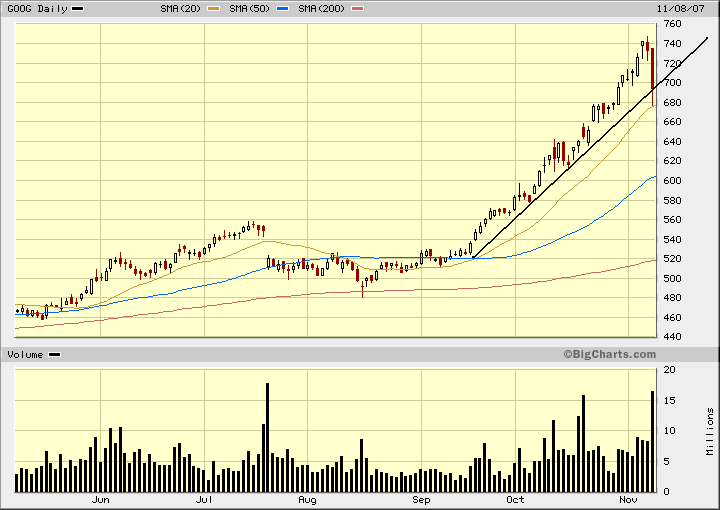
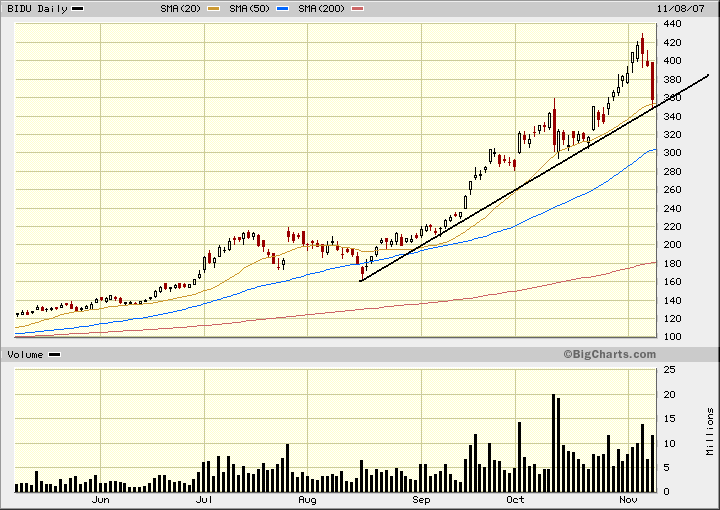
Today we saw some of the market leaders take big hits on high volume.

Apple:


Google:


Bidu


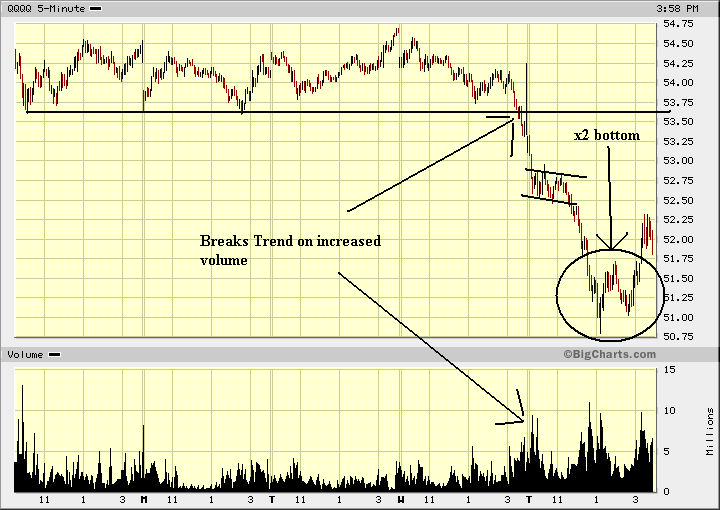
On the 5 day chart, the damage from today's sell-off is clear:


The QQQQs fell through support on heavy volume, formed a double bottom and then rallied. The end of the day rally looks to me like purely technical buying rather than fundamentally based purchases. That is, the index got cheap on a daily basis so traders came in and made some buys.


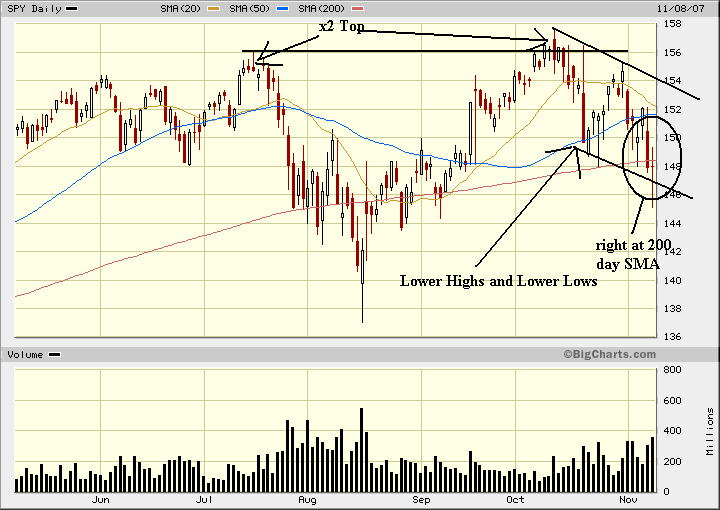
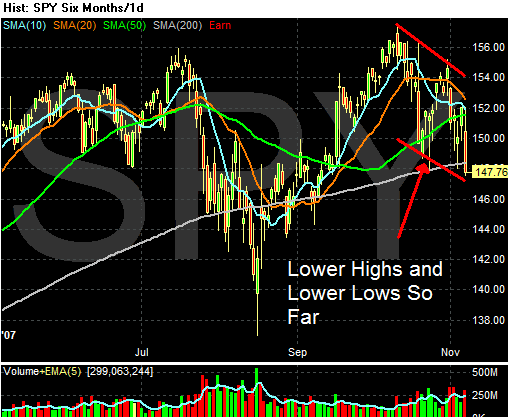
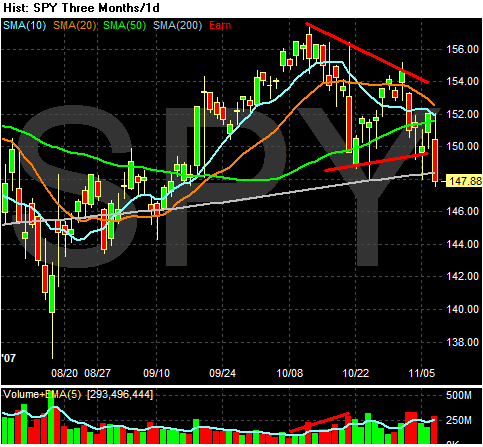
The daily SPYs are look more and more like they formed a double top and are in the middle of a correction with lower highs and lower lows. Also note that prices are sitting on the 200 day SMA.


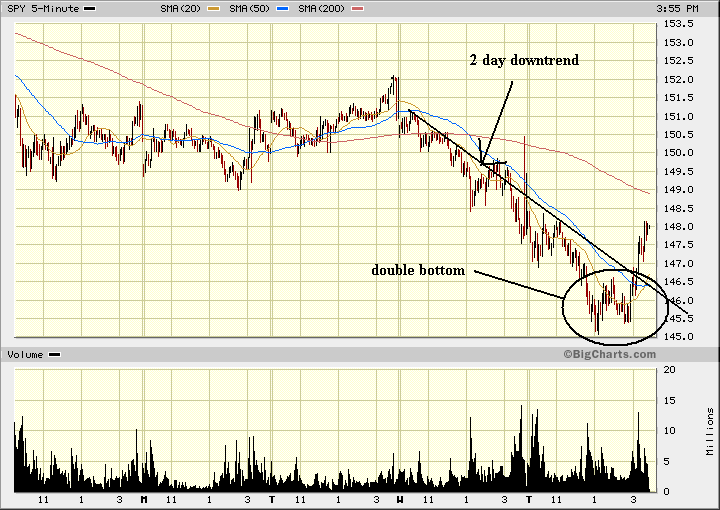
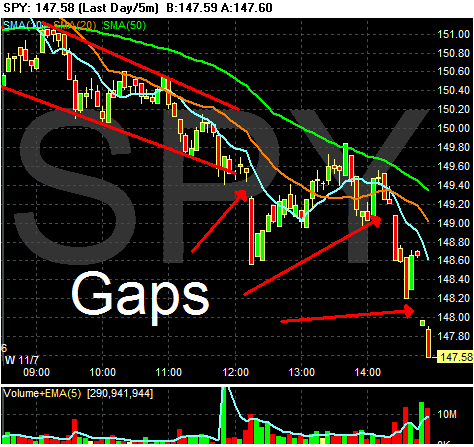
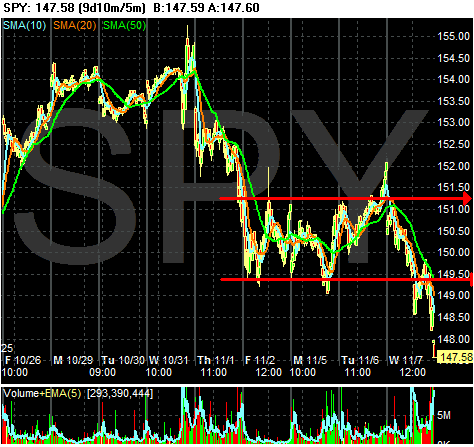
The 5-day SPYs show a clear two day downtrend leading to a double bottom followed by a technically based rally into the close.

Yesterday's action hit the SPYs hard. Today's action hit the QQQQs with the same degree of ferocity.

Bernanke's Statements

From the Federal Reserve:

Looking forward, however, the Committee did not see the recent growth performance as likely to be sustained in the near term. Financial conditions had improved somewhat after the September FOMC action, but the market for nonconforming mortgages remained significantly impaired, and survey information suggested that banks had tightened terms and standards for a range of credit products over recent months. In part because of the reduced availability of mortgage credit, the contraction in housing-related activity seemed likely to intensify. Indicators of overall consumer sentiment suggested that household spending would grow more slowly, a reading consistent with the expected effects of higher energy prices, tighter credit, and continuing weakness in housing. Most businesses appeared to enjoy relatively good access to credit, but heightened uncertainty about economic prospects could lead business spending to decelerate as well. Overall, the Committee expected that the growth of economic activity would slow noticeably in the fourth quarter from its third-quarter rate. Growth was seen as remaining sluggish during the first part of next year, then strengthening as the effects of tighter credit and the housing correction began to wane.


Put all of this in the "duh!!!" column.

The Committee also saw downside risks to this projection: One such risk was that financial market conditions would fail to improve or even worsen, causing credit conditions to become even more restrictive than expected. Another risk was that, in light of the problems in mortgage markets and the large inventories of unsold homes, house prices might weaken more than expected, which could further reduce consumers' willingness to spend and increase investors' concerns about mortgage credit.


Y'think, Ben? Existing home inventories are near their historical high by a wide margin, home vacancies are high, credit is tightening and the US consumer is already coping with an incredibly high debt load. All of those factors just might lead to further home price deterioration.

The Committee projected overall and core inflation to be in a range consistent with price stability next year. Supporting this view were modest improvements in core inflation over the course of the year, inflation expectations that appeared reasonably well anchored, and futures quotes suggesting that investors saw food and energy prices coming off their recent peaks next year. But the inflation outlook was also seen as subject to important upside risks. In particular, prices of crude oil and other commodities had increased sharply in recent weeks, and the foreign exchange value of the dollar had weakened. These factors were likely to increase overall inflation in the short run and, should inflation expectations become unmoored, had the potential to boost inflation in the longer run as well.

In case you were wondering, none of the following charts are important in any way shape or form, and they do not -- repeat DO NOT -- show any energy or agricultural price inflation in any way, shape or form. In fact -- just ignore the following chart, because the Federal Reserve does.
Corn


Wheat


Oats


Oil


Propane


Heating Oil

A Closer Look at Retail

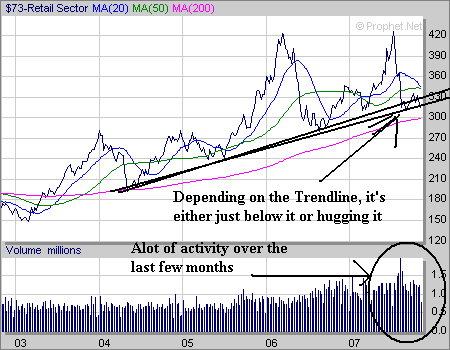
With retail sales coming out today, it seems like a good time to look at the retail sector, with an emphasis on apparel stocks.


Here's the overall retail chart from Prophet.net. Notice that depending on which trend line you use the index is either at the line or just below it. It's important to remember that sometimes the exact trendline is difficult to discern until after something happens. What's important is to catch the general feel of the stocks movement.

Also note the heavy volume that has occurred over the last few months on the downward price action.


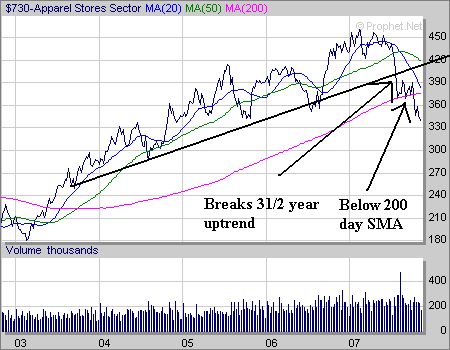
The apparel sector has two bearish indicators.

1.) The index has broken a three and a half year upward trend.

2.) The index is below the 200 day simple moving average (SMA).

Both of these are very bearish developments.

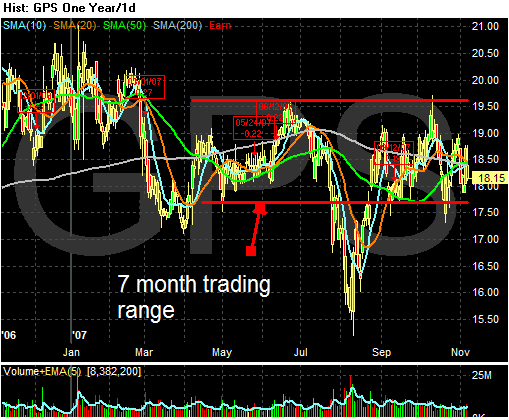
According to Yahoo Business the five largest apparel store stocks are the Gap, Nordstrom, the Limited, Abercrombie and Fitch and American Eagle Outfitters. Let's take them from the largest market down.


The GAP is trading in a nine month range. Notice that after the July market sell-off the stock quickly moved back into the trading range it established.


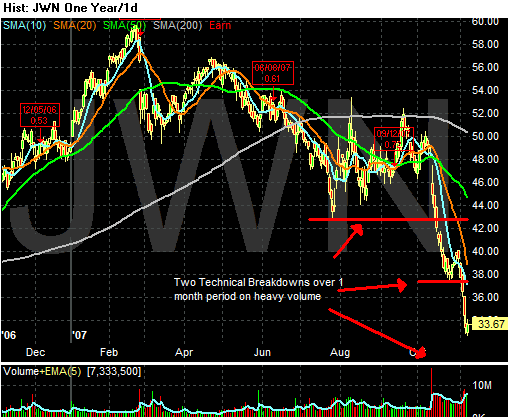
Over the last month Nordstrom (JWN) has completely broken down on heavy volume. The stock is below the 200 day SMA, the shorter SMAs are below the longer SMAs and prices are below all the SMAs. Simply put, this is a bearish chart.


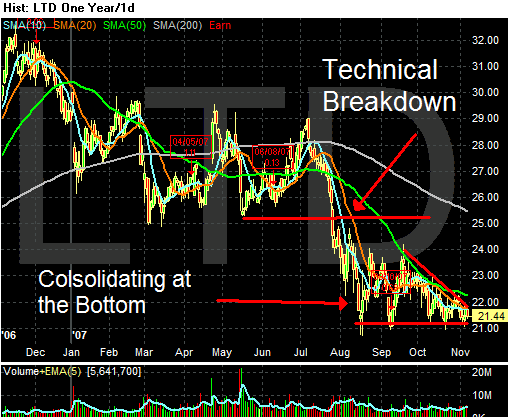
The Limited is below it's 200 day SMA, which is bearish territory. However, prices appear to have consolidated over the last two months. Also note the shorter SMAs are bunched-up indicating a lack of overall direction.


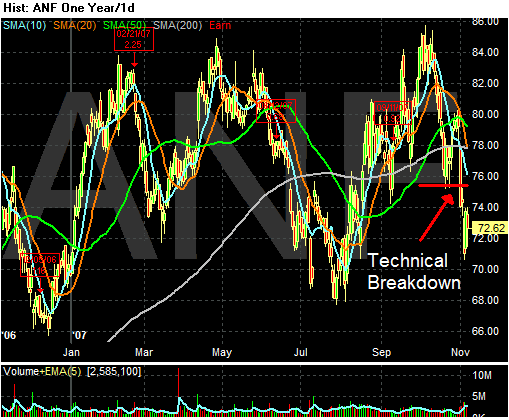
Abercrombie and Fitch is below the 200 day SMA, indicating bearish sentiment. Also note the technical breakdown over the last week on heavy volume. The shorter SMAs are both pointing lower as well.


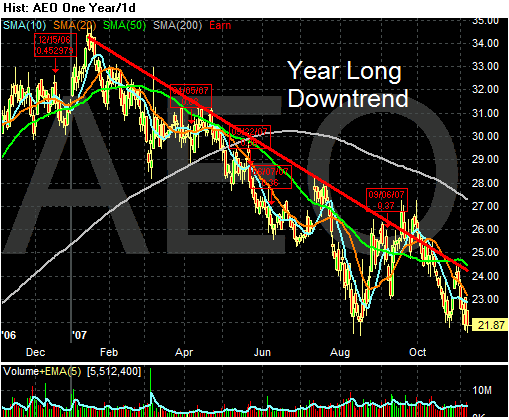
American Eagle Outfitters has been in a clear downtrend for the last year.

Your Daily Writedown Post

From CNBC:

Morgan Stanley on Wednesday said it has suffered a $3.7 billion loss stemming from its U.S. subprime mortgage exposure, which it expects will reduce fourth-quarter earnings by about $2.5 billion.

The Wall Street investment bank said the loss occurred in September and October, and might change before its fiscal quarter ends this month.

It attributed the loss to deterioration in capital markets, which was triggered in large part by the struggles of thousands of homeowners to keep up with mortgage payments. Morgan Stanley said markets may remain unsettled for several quarters.


From CNBC:

Merrill Lynch said on Wednesday its total exposure to risky collateralized debt obligations and subprime mortgages is $27.2 billion, or about $6.3 billion more than what the company disclosed late last month.

Merrill's larger figure is mostly because of a deeper level of disclosure surrounding its banking operations. For the first time, the world's largest brokerage disclosed $5.7 billion worth of exposure to U.S. subprime mortgages at Merrill Lynch Bank USA, a Utah-chartered industrial bank, and Merrill Lynch Bank & Trust Co., a full-service thrift.


From the AP:

Losses in AIG's investment portfolio, credit-swap portfolio and mortgage-insurance business added up to about $1.4 billion, and caused net income to fall by 27 percent compared with last year's third quarter.

Back in August, AIG called exposure to subprime debt "minimal." On Wednesday, it maintained that despite some losses due to mortgage-backed bonds, its exposure to the debt remains "high quality," with "substantial protection."


Overnight an additional $11.4 billion in losses was announced. The figures are almost becoming mind-numbing.

Wednesday, November 7, 2007

Is the S&P Topping?


This is a nine year chart of the SPYs. Notice how the high reached nine years ago has provided a ton of upside resistance to the market.


Here is a 6 month chart. Notice how since the early October highs the market has made lower highs and lower lows? Also note the market broke through the 200 day SMA yesterday on strong volume.

Also note what is happening in the markets right now. There is a ton of bad news that is sinking into the overall trading psychology. The housing market is dropping with no end in sight. Financial firms are writing down mortgages -- literally every big firm has had to do so. Oil is spiking and the Christmas shopping season is around the corner. In short, there are a lot of reasons for the market to drop right now.

Food for thought.

I Just Can't Let This One Pass

From Larry Kudlow:

Today’s report of a high 4.9 percent third-quarter gain in productivity, or output per hour, strongly suggests that the commodities boom is not inflationary.

In relation to booming economic demands worldwide, commodity supplies are scarce. Over time, high commodity prices will stimulate big increases in commodity investment and production. But in the short run, the high commodity-price signal means that commodities are still scarce. It’s a relative price adjustment, not a true global inflation.


From the latest inflation report:

Thus far this year, energy costs have risen at an 11.7 percent SAAR after increasing 2.9 percent in all of 2006. In the first nine months of 2007, petroleum-based energy costs (energy commodities) advanced at a 20.6 percent rate and charges for energy services (gas and electricity) increased at a 1.3 percent rate. The food index rose at a 5.7 percent SAAR in the first nine months of 2007 after advancing 2.1 percent in all of 2006. Grocery store food prices increased at a 6.7 percent annual rate in the first nine months of 2007, reflecting acceleration over the last year in each of the six major groups. These increases ranged from annual rates of 4.0 percent in the index for other food at home to 17.7 percent in the index for dairy products.


No -- there's no inflation at all. None at all.

Today's Markets


This is a very ugly daily chart.

1.) The overall direction is down -- big time down.

2.) There are three downward gaps that occurred on heavy volume. That's not good.

3.) The market closed at the low point, on heavy volume just after the third gap down. That's a triple whammy of bad events. Traders didn't want to hold positions overnight because they were concerned something would happen between now and the open that would lower stock prices.

Why are gaps down bad? To Quote Bulkowski from Encyclopedia of Chart Patterns, "...in both cases [of upward and lower gaps] some type of exuberance is driving the stock to create a gap (page 241)." In other words, there is a strong emotional reason for the change. It's safe to say that a downward gap is a sign of extreme concern. When there are three gaps on a single day, it's s sign of really extreme concern.


The 9-day chart shows the SPYs were in a three and a half day consolidation/trading range. But they broke through support on heavy volume at the end of trading. Breakdowns indicate a change in sentiment. When they occur on heavy volume sentiment it's that much more intense.


The SPYs daily chart shows we have broken through support and the 200 day SMA on heavy volume. Again a triple whammy.


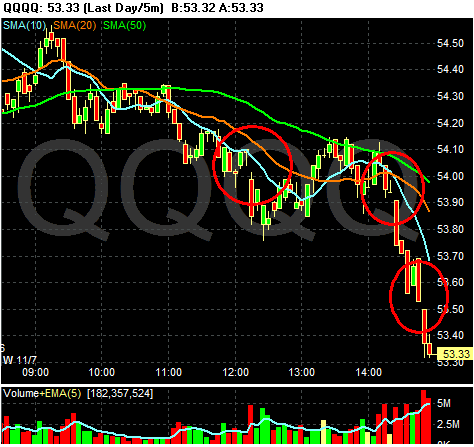
The one day QQQ chart also shows three downward gaps that occurred on heavy volume. Also notive the index sold-off at the end of trading on heavy volume.


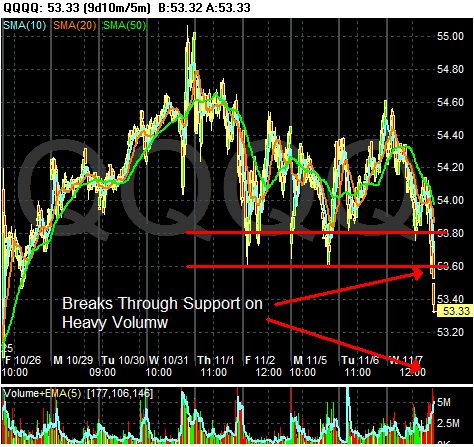
The 10-day QQQQ chart shows they too were in the middle of a consolidation pattern, but they also broke through support on heavy volume at the close of the market. This is not good.


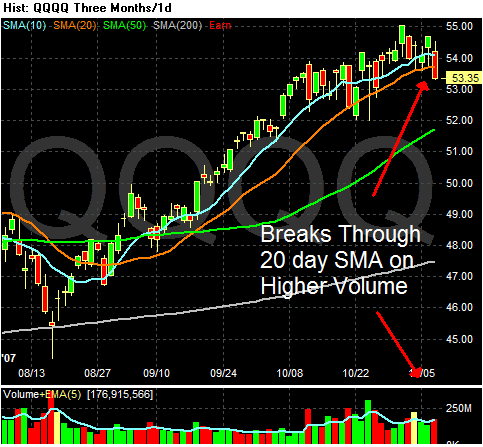
The daily QQQQ chart shows the index broke though the support of the 10 and 20 day SMA on heavy volume. That's very bad.

In addition, consider these two charts from stockcharts.com.

NASDAQ Breadth


NASDAQ new highs/new lows


Both of these charts tell us that fewer and fewer NASDAQ stocks were responsible for the index's gains. That indicates there was a lack of breadth across a wide swath of stocks.

Short version -- this day was terrible. It did a lot of technical damage.

Read This Now

Afraid to Trade has a great post on moving averages. They are among my favorite indicators and this post partially explains why.

The Words "Crisis" and "Dollar" Appear in the Same Sentence

From Marketbeat:

“We’re in the midst of a dollar crisis here and the market is reflecting on the high cost of oil and the falling dollar and soaring gold prices,” says Peter Cardillo, chief market strategist at Avalon Partners. “The good economic news is going to be overshadowed by the dollar crisis that we’re now in.”


The reason?

The dollar fell the most since September against the currencies of its six biggest trading partners after Chinese officials signaled plans to diversify the nation's $1.43 trillion of foreign exchange reserves.


The standard method of public communication from Asian central banks is to make a public statement, deny it is official policy, but then act as is it were official policy. Here is a link to the Treasury International Capital Page that shows Asian central banks haven't been buying Treasuries that much over the last year.


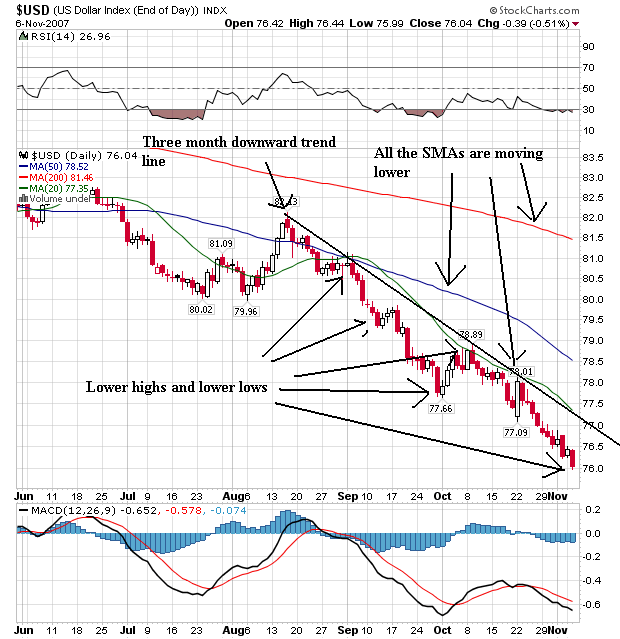
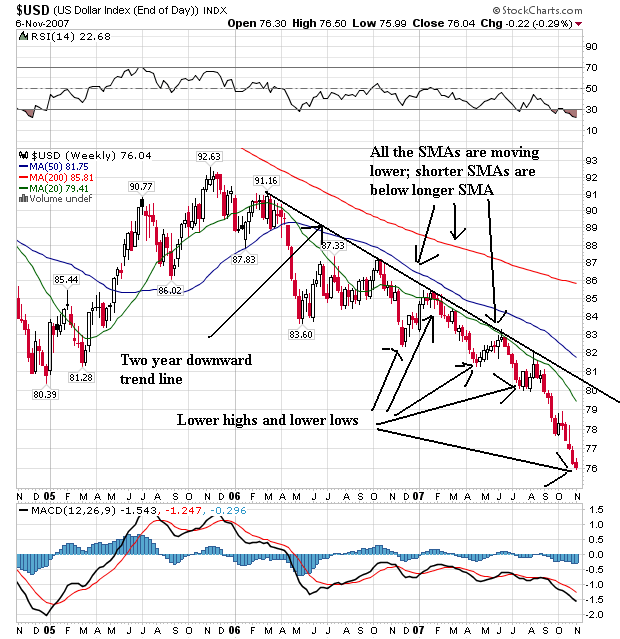
The dollar's daily and weekly charts are both extremely bearish. Notice

1.) There are strong downward trends in place.

2.) All of the simple moving averages (SMAs are moving lower).

3.) The short SMAs are lower than the longer SMAs.

4.) Prices are below the SMAs, indicating the SMAs will be moving lower.

The bottom line is these are both extremely bearish charts.

What Inflation?

From CNBC

Food maker Sara Lee said Wednesday its fiscal first-quarter profit dropped 40 percent due to higher commodity costs and an increase in marketing and advertising spending.

For the quarter ending Sept. 29, net income fell to $200 million, or 28 cents per share, from $333 million, or 44 cents per share in the prior year quarter.

Analysts polled by Thomson Financial expected earnings per share of 27 cents.

Sara Lee said its profit was hurt by "a very challenging input cost environment" as prices rose for commodities such as wheat, poultry, pork and green coffee.


There is no need to look any further, because we all know that those silly and meaningless price fluctuations from agricultural prices are unimportant and should play no role in interest rate policy. In fact, just ignore the following chart because it has no effect on anything.


For those of you who looked, notice the Goldman Sachs agricultural price commodity index has risen almost 90% in three years. But remember -- it's not part of core inflation, so it doesn't matter....unless you're a Sara Lee stockholder.

Can anyone at the Federal Reserve read a damn price chart?

Gas Prices and Holiday Spending

From the WSJ:

Gasoline has trailed oil's rise to nearly $100 a barrel, but fuel prices now look poised to take off.

Oil climbed $2.72 to $96.70 a barrel in New York Mercantile Exchange trading, bringing it closer to an inflation-adjusted high of $101.70 reached in April 1980. The sharp rise and an extended period of high prices has sent heating oil to new highs. (Please see related article.)

Gasoline is now expected to follow, potentially taking money out of the pockets of consumers at a time of weakening growth in consumer spending.

The average price of regular gasoline was $3.02 a gallon, according to AAA, formerly the American Automobile Association. That was up from $2.77 last month and from $2.20 a gallon a year ago. "Unfortunately between now and the end of the year gasoline prices will continue to rise if oil stays above $95 a barrel, and certainly if it goes above $100 a barrel," says Geoff Sundstrom, spokesman for the AAA.


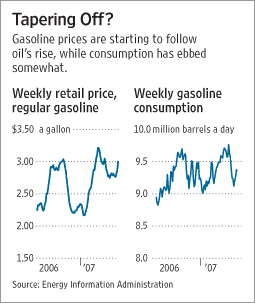
The article also has the following chart:


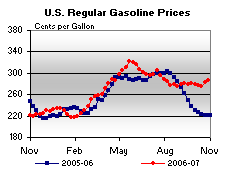
Here's another chart of gasoline prices from This Week in Petroleum.


Notice that gas prices are usually seasonal, rising in the summer as demand picks up and dropping in the fall as demand falls. However, thanks to record high oil prices, that pattern isn't occurring this year (at least so far). As a result:

Anxious retailers are already clamoring to outdo each other with bigger and better Black Friday-like deals, threatening to make Black Friday itself a non-event this year.

"Black Friday this year may show some signs of vulnerability if retailers keep promoting to the extent that they already are," said Marshal Cohen, chief retail industry analyst with market research firm NPD Group.

Wal-Mart (Charts, Fortune 500), the world's largest retailer, isn't waiting to jumpstart its holiday sales.

Wal-Mart already treated its shoppers to an appetizer of its holiday blockbuster deals this past weekend, which included a 14-inch Acer LCD-screen laptop for $348 and a Sanyo 50-inch plasma HDTV for $998.

.....

Toys "R" Us shipped its annual holiday discount catalog late last month. Wal-Mart's rival Target (Charts, Fortune 500) rolled out it's holiday ad insert this past weekend.

Department store chain J.C. Penney (Charts, Fortune 500) currently is touting "The biggest sales of them all!" at its stores, offering its shoppers 20 to 60 percent off on clothes and home-related goods.

Also this week, Penney's rival Kohl's (Charts, Fortune 500) has cut prices by as much as 40 percent on sweaters, 50 percent on footwear and 60 percent on jewelry.

Among specialty sellers, both American Eagle Outfitters and Aeropostale (Charts) set 50 to 60 percent discounts on jeans and sweatshirts.


A few points need mentioning.

1.) Oil prices are extremely volatile right now. One of the primary reasons for oil's increase is the situation along Northern Iraq with Turkey. If this situation resolves peaceably then a large stimulus for oil's increase will be gone and traders will probably take profits. In other words, oil's price increase is extremely fluid.

2.) Counting out the US consumer is a very bad idea. Americans love to shop and usually find a way to do so, regardless of how. So don't bet against them yet.

3.) The housing market has been in turmoil for about a year now. At this time last year, we were getting the first signs of problems in the mortgage market. But the story really wasn't that important than. Now we've had a year of dropping home prices, huge write downs at various Wall Street Firms, a big summer stock market correction caused by mortgage related problems and two interest rate cuts. Another way to put this is the housing market story has been in the news prominently for about a year and none of the news has been good. This has had a definite impact on consumer sentiment, which is at it's lowest level since May 2006. So the overall consumer sentiment environment has definitely changed for the worse over the last year.

Retailers are concerned enough to start lowering prices and offering incentives. And traders are selling department store shares, indicating they are concerned enough to drop retail positions.

It's shaping up to be a very difficult Christmas shopping season.