
This is a very ugly daily chart.
1.) The overall direction is down -- big time down.
2.) There are three downward gaps that occurred on heavy volume. That's not good.
3.) The market closed at the low point, on heavy volume just after the third gap down. That's a triple whammy of bad events. Traders didn't want to hold positions overnight because they were concerned something would happen between now and the open that would lower stock prices.
Why are gaps down bad? To Quote Bulkowski from Encyclopedia of Chart Patterns, "...in both cases [of upward and lower gaps] some type of exuberance is driving the stock to create a gap (page 241)." In other words, there is a strong emotional reason for the change. It's safe to say that a downward gap is a sign of extreme concern. When there are three gaps on a single day, it's s sign of really extreme concern.

The 9-day chart shows the SPYs were in a three and a half day consolidation/trading range. But they broke through support on heavy volume at the end of trading. Breakdowns indicate a change in sentiment. When they occur on heavy volume sentiment it's that much more intense.

The SPYs daily chart shows we have broken through support and the 200 day SMA on heavy volume. Again a triple whammy.

The one day QQQ chart also shows three downward gaps that occurred on heavy volume. Also notive the index sold-off at the end of trading on heavy volume.

The 10-day QQQQ chart shows they too were in the middle of a consolidation pattern, but they also broke through support on heavy volume at the close of the market. This is not good.

The daily QQQQ chart shows the index broke though the support of the 10 and 20 day SMA on heavy volume. That's very bad.
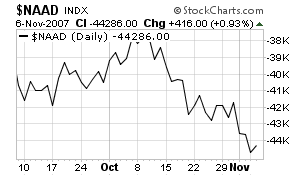
In addition, consider these two charts from stockcharts.com.
NASDAQ Breadth

NASDAQ new highs/new lows

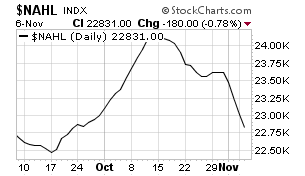
Both of these charts tell us that fewer and fewer NASDAQ stocks were responsible for the index's gains. That indicates there was a lack of breadth across a wide swath of stocks.
Short version -- this day was terrible. It did a lot of technical damage.


6 comments:
Hi Bonddad: long time fan, first time commenter.
I had a question that I thought you might be able to answer. I'm considering buying a house soon, and I've been reading a lot of the bubble blogs. I've noticed that many of these blogs are written by folks who also advocate investing in gold, generally support Ron Paul, and are very critical of US government macroecon policy.
If they support Ron Paul, and gold investing, how credible are they? I'm very critical of US economic policy, but just from a moderate liberal perspective. And so while they and I share a few things in common, my understanding is that gold investing is a fringe investment. (Not to mention Ron Paul is a wacko.)
Why is there so much overlap among bubble bloggers, Paulites, and gold investors? Should I discount their advice? Should I not worry about it?
Thanks, and keep up the good work!
Also a fan. In looking at your chart today, I can see the "gaps," but I don't understand what that represents. How do the charts "gap" downward? What do these "gaps" represent as to what is going on on the trading floor? Just curious. Trying to learn and understand your economics lessons. Thanks.
And to George. I really haven't followed all of Paul's policy indications, but when I do hear him talk, he actually seems a lot closer to me (fairly liberal) on a lot of issues than do a lot of the Democratic field. I mean, he's for getting out of Iraq now, as opposed to most Dems. I understand there are some very non-liberal things about him (or so I'm told). But still. Country could use a good shake up maybe. Paul or someone else.
Bonndad,
FWIW, my quote service (Schwab), does not ever) show the gaps that yours does in the five minute charts. I looked at Big Charts--same. It seems to me something is wrong. Something like SPY with its huge volumes would not normally have intra-day gaps. You are finding them frequently. I never see them.
Just in watching the tick data go by, gaps do not appear. They should not appear in your charts.
well, I've turned quite bearish over the past few months and have hit a lot of "bear" sites, and yeah a lot of them are on the far side of right-wing. I've learned to ignore it. and yeah there's a ton of wingnut "gold bugs" who make chicken little look like a superhero and a lot of Ron Paul fanbois as well.
stick to your principles :) oh and me? I would run not walk from buying a house for awhile unless you live someplace where values haven't seesawed over the past 5-6 years, and if you don't at least get a traditional 30yr fixed w/20% down and plan on living there for a long time. just my worthless free advice.
bdad, what charting site/app do you use to make the black charts with the big ticker symbol in em?
I don't know about Ron Paul, but I too am an avid reader of this blog, and while I don't comment very often, I wanted to throw in my two cents in regards to your questions. On a personal note, I bought a house 2 years ago, and know how you feel in terms of where to put your money.
Right now I've got everything broken out into four stocks:
PBR - PetroBrazil (25%)
CNQ - Canadian Natural Resources (15%)
IAU - Gold ETF (40%)
ORCL - Oracle (20%)
This was pared down from a wider spread of securities about 4 months ago.
With this mix, I've been getting hit at half the impact the rest of the market is feeling on most down days, and when there's a rally, I'm not missing out on anything.
I don't want any of my investments right now to be tied into US household discretionary spending/consumer spending, manufacturing, financial services or telecom/cable.
I don't go anywhere without my garlic and crucifixes...I guess that's what I'm saying. Even China looks like a roulette wheel to me. It's not good.
Gold's rise is predictable, and you should get well if you can on some shares of IAU. Since I liquidated many various shares and put it all into IAU, it has gained 20%. At least until January I'm not moving any of that money.
2008 is looking like 2007 in terms of the liklihood of Bush losing his mind and bombing Iran, so the oil stocks (the right ones) should continue to move up along with the price per barrel.
PBR is my longest held stock going on 4 years now.
It sounds crazy...but don't overthink it. A market like this one, pay close attention to the signs and make your plays based on what is, not on 'what might be'.
PBR up 12.5% as of 2PM today
Maybe now's not the time, but I urge everyone to keep it on their watchlists.
Post a Comment