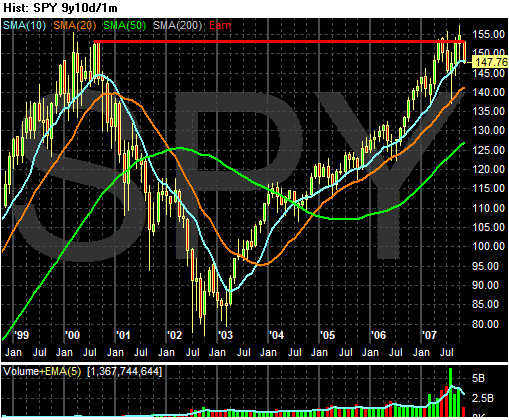
This is a nine year chart of the SPYs. Notice how the high reached nine years ago has provided a ton of upside resistance to the market.
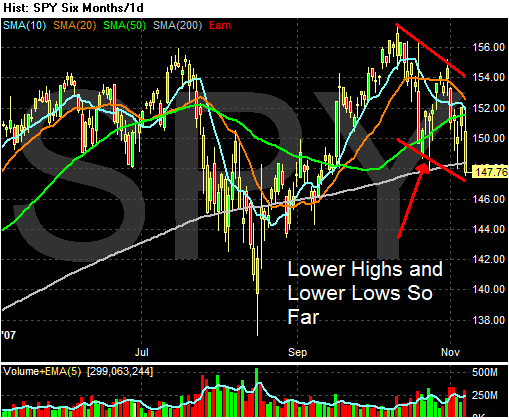
Here is a 6 month chart. Notice how since the early October highs the market has made lower highs and lower lows? Also note the market broke through the 200 day SMA yesterday on strong volume.
Also note what is happening in the markets right now. There is a ton of bad news that is sinking into the overall trading psychology. The housing market is dropping with no end in sight. Financial firms are writing down mortgages -- literally every big firm has had to do so. Oil is spiking and the Christmas shopping season is around the corner. In short, there are a lot of reasons for the market to drop right now.
Food for thought.