Tuesday, March 12, 2019

Real wage growth continued to improve in February


 - by New Deal democrat.     

Now that we have February’s CPI (up +0.2%), let’s update nominal and real wage growth.

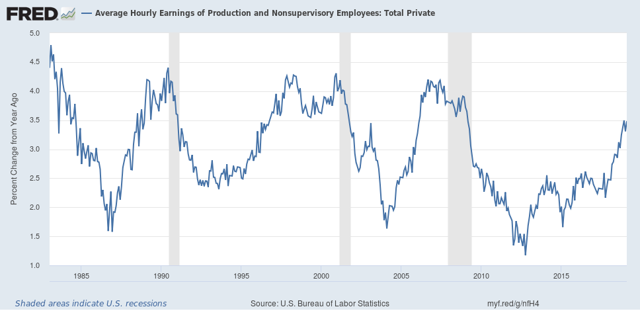
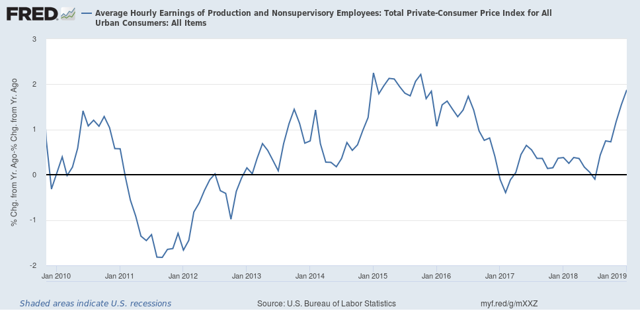
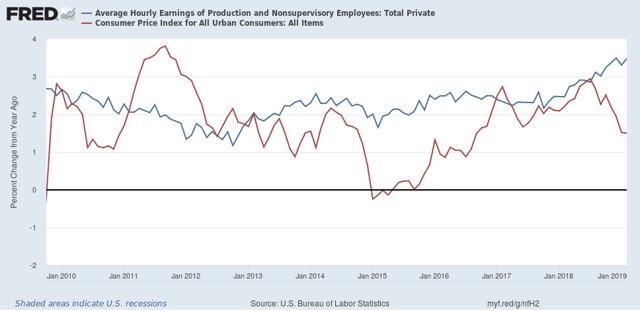
First, here is a graph of nominal wage growth YoY vs. consumer inflation YoY since the beginning of this expansion almost 10 years ago:


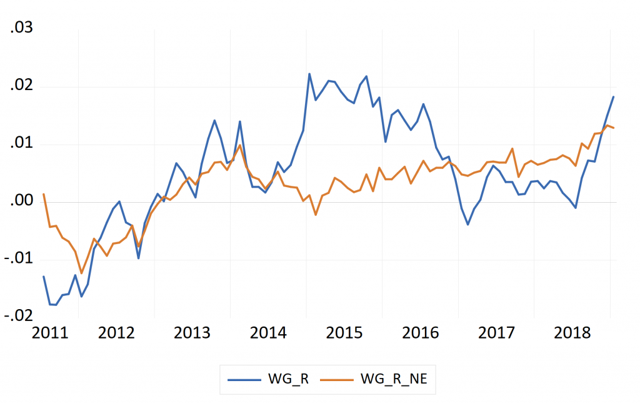
First of all, why do I bother with nominal wages? Because employers don’t give out inflation-adjusted salary and wage increases. If they give you a 3% raise, it’s a 3% raise regardless of what happens to inflation. And the long term picture is that nominal wage growth decelerates coming out of recessions until unemployment (or, more likely, underemployment) falls to the point where employees gain a little bargaining power:


To return to the first graph, nominal wage growth has been improving YoY since late 2012. Meanwhile CPI has been meandering around a 2% YoY average, depending on what has been happening with gas prices. Since lately these have been stagnant or down YoY, consumer inflation has waned.

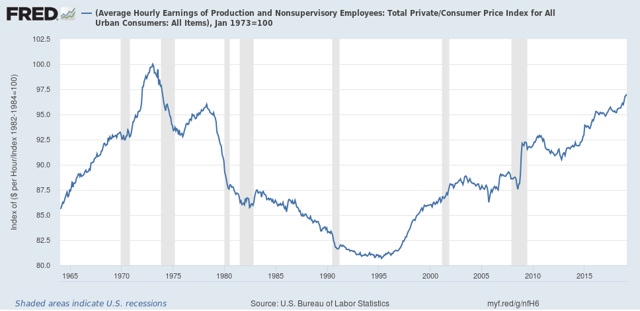
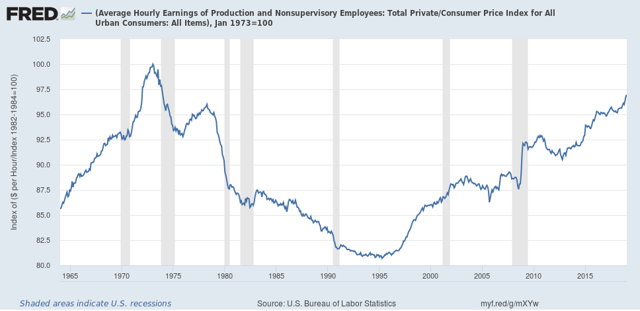
As a result, real wages have improved considerably in the past year, to the point where they are now exactly -3% off their peak in the early 1970’s:


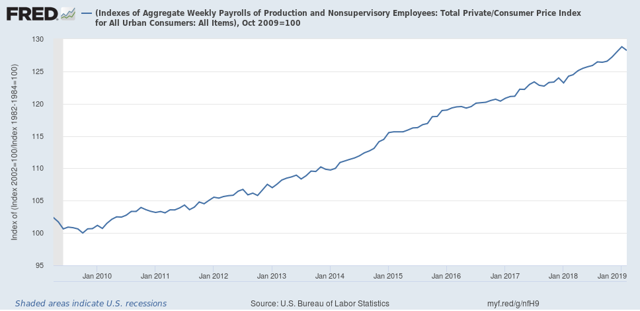
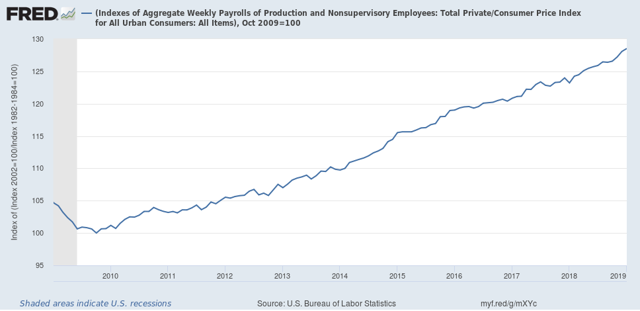
But because aggregate payrolls declined in February, according to the employment report, the aggregate pay that non-managerial workers took home, in real terms, declined by -0.4% in February. In real terms, this amount has increased by 28.2%, down from an increase of 28.6%, more than they earned at the worst point after the Great Recession in October 2009:


Neverthelss, real wage growth in general continued to be good news. Be aware, however, that real wage growth is a long *lagging* indicator, that starts up well after a recession bottoms, and can continue even into the next recession.

Monday, March 11, 2019

Negative Nov. and Dec. revisions overwhelm positive January retail sales


 - by New Deal democrat

The initial spin on this morning’s delayed retail sales report for January has been positive, with for example the Wall Street Journal calling it a “rebound” and “a sign of solid economic momentum in the first quarter.”

Ummmmm, No.

Both nominally and in real terms, retails sales did improve by +0.2% in January over December.

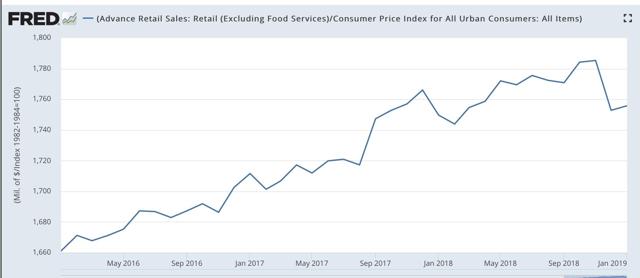
The problem is, both November and December were revised downward. In particular, December’s initially reported poor -1.2% showing got even worse, to -1.6% nominally. In other words, for the two months combined, retail sales even measured nominally declined by -0.2%.

Here’s what they look like in real terms through January:  


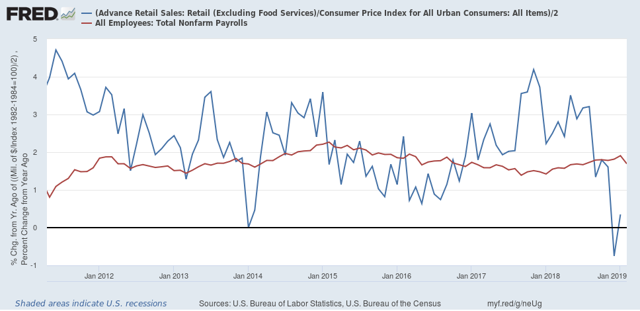
Because real retail sales tend to lead employment (red in the graph below) with a variable lag on the order of 6-9 months, this downturn in retail sales is more evidence that February’s poor employment report should not simply be dismissed as an outlier:


On a YoY basis, real retail sales peaked over a year ago. They have sharply decelerated since then all the way to roughly zero. We should expect employment gains to also decelerate, and February’s poor report is consistent with such a deceleration having started.

I expect to put up a more detailed look at Seeking Alpha, probably tomorrow. Once it is up, I will link to it here.

Sunday, March 10, 2019

A modest proposal to use FICA-style tax withholding as a transition to “Medicare for All”


 - by New Deal democrat

Probably the foremost reform advanced by the Democratic Party at present is “Medicare for All.” Personally I don’t particularly care whether it is ultimately necessary to have single payer (like Canada) or universal coverage (like France or Germany) or a hybrid of each (like Australia). I am fond of the Japanese saying that translates as “There are many paths to the top of Mount Fuji,” but let’s set that aside for now.

What is generally acknowledged is the problem of how to create a “bridge” between the hodge-lodge of government and employer-based coverages we have now to whatever is ultimately passed as “Medicare for All.” That’s because there will understandably be a lot of blowback if people “lose” an employer healthcare plan, or else get hit with a new tax.

I propose that a system of payroll tax withholding that includes Obamacare and “Medicare for All” plans in addition to employer-provided medical benefits will work. Specifically, I propose three tweaks to Obamacare as it existed in 2016:

       1. Two new spaces for mandatory FICA-style tax withholding spaces are added to each paycheck. One is for “Medicare for All” employment coverage, and the second is for “Medicare for All” unemployment coverage.   

     2.  The individual mandate penalty that the GOP killed in 2018 remains dead. But it is replaced, in all cases where an individual is not covered by employer-provided coverage, with an automatic payroll deduction for individual enrollment that defaults to the least expensive monthly bronze plan for individuals under 40, and the least expensive monthly silver plan for individuals age 40 through 64. This would kick in only for new employees in the first two years, after which it would apply to all employees.

     3. Employers could voluntarily purchase, on behalf of their employees, coverages that are at least at the mandated levels set forth in #2 above.

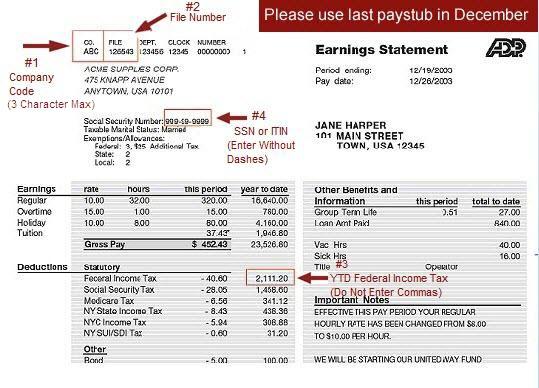
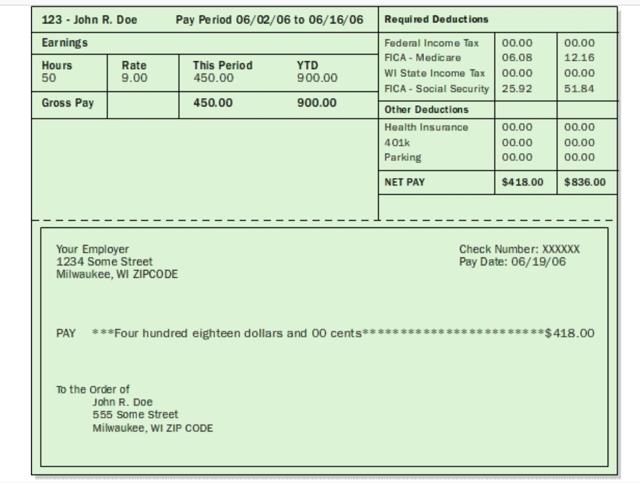
Here’s how it would work. Let’s start with two specimen paychecks. The first is from New York State. The second is for a state that does not have Medicaid expansion or mandatory unemployment withholding.


Note that, as required by law, all employers must withhold Social Security and Medicare taxes (FICA). Each of the two specimen paychecks above has specific boxes for that FICA withholding. By contrast, Medicaid is not funded by payroll taxes, but is a direct government responsibility. Additionally, the employer *may* also withhold taxes for, e.g., the employer’s medical plan, and state unemployment insurance, as we see in the first of the two specimen paychecks above.

As indicated in #1 above, I propose that two more boxes for mandatory withholding would be added to all paychecks. Call them MFA1 for medical coverage while employed, and MFA2 for medical coverage during periods of unemployment. 
 
Most importantly, note that FOR MOST PEOPLE BOTH NUMBERS WOULD BE ZERO! Specifically, both “MFA1 and MFA2” would be zero if the employer provides health coverage, and is subject to COBRA. 

But if the employer does *not* provide coverage, then, just like when you start a job you tell your employer how many standard tax deductions to withhold, a person with an Obamacare policy would have that amount withheld and either automatically sent to their provider, or a second check made out by the employer to the provider. If an employee d oes not have Obamacare, and does not select a provider, then the MFA1 withholding would pay the default low cost bronze or silver Obamacare provider, depending on the employee’s age, as set forth in #2 above.

Further, an employer who is not currently providing coverage, or wants to end their own program and switch to an Obamacare plan, could automatically enroll all employees in such a plan, provided the Obamacare plan is at least at the equivalent level of the employer’s current plan. I envision this provision might be temporary, e.g., in effect for only 5 or 10 years by which time I suspect most employers will be out of the employer-sponsored healthcare business.

“MFA2” would be meant to fund Obamacare insurance coverage for those who are not employed and are not covered by  SCHIP, VA coverage, or a state-sponsored Medicaid  or unemployment plan (Hence the difference between the two paychecks). I anticipate that this would be a small universe of people. Just as a back of the envelope guess, let’s peg that at 5% of the total. In other words, it anticipates that for all people as an average, maybe for 2 of 40 working years between 25 and 65, that average  person would need such coverage. If the average Obamacare premium were, let’s say $400 per month, 5% would be an MFA2 amount of $20. Again, in a state where Medicaid or other plan covers this, THE AMOUNT  OF MFA2 TAX WITHHOLDING WOULD BE ZERO. IT WOULD ALSO BE ZERO IF THE PERSON HAS AN EMPLOYER PLAN, IN WHICH CASE COBRA APPLIES.

Finally, I envision the plan being phased in for new employees for 2 years. That’s because there is a lot of job turnover. Many if not most people who do not have employer healthcare coverage, nor existing Obamacare policies, are likely to start a new job during that period. Thus, they’re never going to notice a decrease in take-home pay in an existing paycheck, because it won’t happen! It is simply going to be part of the standard deductions in the paycheck they receive from a new job.

In summary, under my for a FICA-based “bridge” to “Medicare for All”:
  • ALL medical coverage for workers, whether provided by the employer or by Obamacare or “Medicare for All”, would be paid for by mandatory withholding taxes in paychecks.
  •  a person who has an existing employer healthcare plan won’t have to give up their plan. They will also pay no new taxes. 
  •  A person who presently is covered by Obamacare or some other government plan individually likewise won’t have to give up their plan. At most their premiums will be paid directly out of their paycheck vs. having to pay individually out of their take home pay, and they will have to pay the “MFA2” withholding. But they won’t even notice that if they get a new job within the first two years. 
  • Nobody on any existing other government plan is affected. And EVERYBODY is covered, including those who don’t qualify for any other plan including existing Obamacare — that’s what “MFA2” withholding is for. At worst if they started out adulthood with no coverage, and had no job, so that they had never paid for “MFA2” coverage before, there might be a lien or surcharge on their “MFA2” withholding once  they started their first job.
  • in combination with all existing private and public plans, this proposal provides universal health care coverage.

Submitted for your consideration.

Saturday, March 9, 2019

Weekly Indicators for March 4 - 8 at Seeking Alpha


 - by New Deal democrat

My Weekly Indicators post is up at Seeking Alpha.

The distortions caused by the government shutdown appear to have ended, which has given the indicators generally a little boost.

As always, clicking on the link and reading should hopefully be educational for you, and helps reward me a little bit for the work I put in.

Friday, March 8, 2019

February jobs report: the first sign of the economic slowdown spreading to jobs?


 - by New Deal democrat

HEADLINES:
  • +20,000 jobs added
  • U3 unemployment rate -0.2% from 4.0% to 3.8%
  • U6 underemployment rate  -0.8% from 8.1% to 7.3% (NEW 20 YEAR LOW)
Here are the headlines on wages and the broader measures of underemployment:

Wages and participation rates
  • Not in Labor Force, but Want a Job Now: down -32,000 from 5.254 million to 5.222 million
  • Part time for economic reasons: down -837,000 from 5.147 million to 4.510 million
  • Employment/population ratio ages 25-54: unchanged at 79.9% 
  • Average Hourly Earnings for Production and Nonsupervisory Personnel: rose $.08 from  $23.10 to $23.18, up +3.5% YoY.  (Note: you may be reading different information about wages elsewhere. They are citing average wages for all private workers. I use wages for nonsupervisory personnel, to come closer to the situation for ordinary workers.) 
Is a recession close?

The more leading numbers in the report tell us about where the economy is likely to be a few months from now. These were mixed.
  • the average manufacturing workweek fell -0.1 hours from 40.8 to 40.7 hours. This is one of the 10 components of the LEI.
  • Manufacturing jobs rose +4,000. YoY manufacturing is up 242,000.
  • construction jobs declined -31,000. YoY construction jobs are up 373,000.  
  • temporary jobs rose +5800. YoY these are up +67,000.
  • the number of people unemployed for 5 weeks or less fell by -131,000 from 2,325,000 to 2,194,000.  The post-recession low was set nine months ago at 2,034,000.

Holding Trump accountable on manufacturing and mining jobs

 Trump specifically campaigned on bringing back manufacturing and mining jobs.  Is he keeping this promise?  
  • Manufacturing jobs rose an average of +12,000/month in the past year vs. the last seven years of Obama's presidency in which an average of +10,300 manufacturing jobs were added each month.   
  • Coal mining jobs increased by 100 for an average of +160/month vs. the last seven years of Obama's presidency in which an average of -300 jobs were lost each month
December was revised upward by +5,000. January was also revised upward by +7,000, for a net change of +12,000.

Other important coincident indicators help  us paint a more complete picture of the present:
  • Overtime was unchanged at 3.5 hours.
  • Professional and business employment (generally higher-paying jobs) rose by +42,000 and  is up +537,000 YoY.
  • the index of aggregate hours worked for non-managerial workers fell by -0.6%
  •  the index of aggregate payrolls for non-managerial workers fell by -0.3%    
Other news included:            
  • the  alternate jobs number contained  in the more volatile household survey increased by +255,000  jobs.  This represents an increase of 1,736,000 jobs YoY vs. 2,509,000 in the establishment survey.    
  • Government jobs fell by -5000.
  • the overall employment to population ratio for all ages 16 and up was unchanged at  60.7% m/m and is up 0.3% YoY.          
  • The labor force participation rate was unchanged at 63.2% and is up +0.2% YoY.

SUMMARY

There are two themes to this report. The first is that it reversed both last month’s establishment and household reports. Last month the first was excellent and the second was poor. This month the establishment survey laid an egg, as featured in the headline number, while the household survey rose smartly, as featured in involuntary part time work, discouraged workers, and both the unemployment and underemployment rates. Positive news also included another good increase in non-supervisory wages.

But this month’s report actually went beyond taking back January’s report. The YoY change in construction, manufacturing, and total jobs for the last two months combined are all lower than they were in December. So we both aggregate hours worked and aggregate payrolls. The manufacturing workweek declined for the second month in a row.  It’s also worth noting that the YoY increase in the household report is significantly lagging the establishment report.

In summation, I suspect this month marked the first month in which the economic slowdown showed up in the jobs report.

Thursday, March 7, 2019

Two more leading sectors to watch for in tomorrow’s jobs report


 - by New Deal democrat

Yesterday I updated my look at temporary jobs, a known leading indicator for jobs overall.  Today I want to look at two more leading sectors: manufacturing and construction. 

Unlike temporary jobs, I’m not looking for a possible decline. Rather, I am looking for a deceleration in growth from their recent peaks. Let’s take them in order.
    
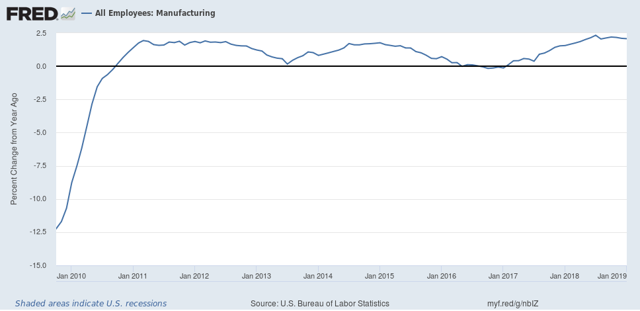
First, manufacturing. Because the ISM is picky about allowing FRED to publish their data, I have to do this in two separate graphs. So, the below two graphs are of the ISM manufacturing index and its new orders sub index, followed by the YoY% change in manufacturing employment:


The important point of the two is that manufacturing jobs tend to follow the ISM index with a 6 to 12 month lag. Thus, for example, the ISM manufacturing index first went into contraction (a reading below 50) in October 2015. Manufacturing jobs didn’t contract YoY until March 2016. By June 2016 the ISM index had turned positive again. Manufacturing jobs didn’t get there YoY until February 2017.

In 2018, the ISM manufacturing index peaked in August. So I am expecting YoY growth in manufacturing jobs to decline. Since one year ago manufacturing added 30,000 jobs in February, I am expecting substantially fewer than that to be added tomorrow.

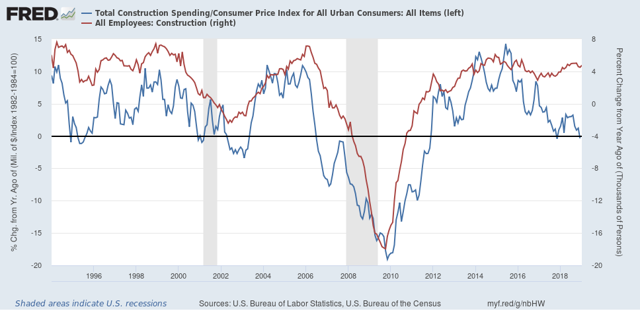
Second, construction. The first graph below compares the YoY% change in construction spending adjusted for inflation (blue) with construction jobs:


Although the former is somewhat noisy, it is pretty easy to see that usually  construction jobs have followed spending by a few months — except in the last couple of years, and arguably during the first couple of years (2006-07) of the housing bust.

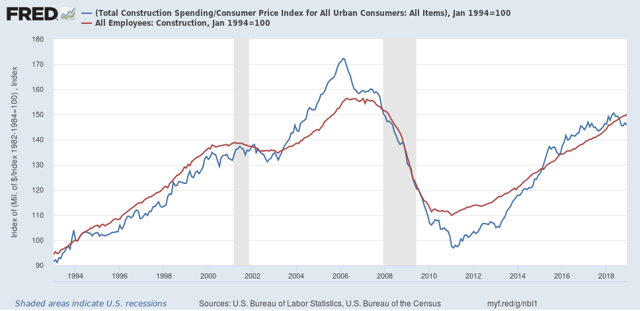
Looking at the absolute values of the same data series is helpful (note that both series have been normal to 100 as of January 1994):


Now we can see that the two grow or decline at nearly identical rates over the longer term, with jobs following spending with a short lag.

But the other thing that jumps out is how spending outpaced jobs growth (I.e., blue line above red line) during the housing boom, and again during 2015-17. This suggests that during those periods existing workers were getting more hours, rather than more workers being hired. When demand waned, first hours were cut before layoffs began. Since spending has only fallen back below jobs in the past half year, I’m not expecting a decline in construction jobs, but rather a leveling off in the YoY pace.

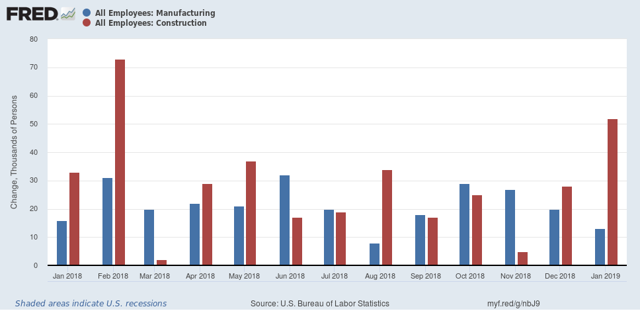
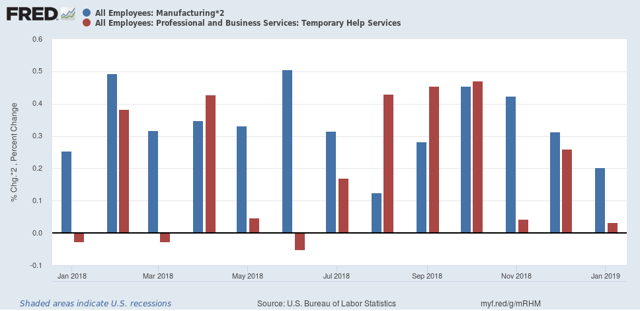
This can be summed up by looking at the monthly gains for the past year in manufacturing (blue) and construction (red):


Tomorrow I am looking for continued gains in both manufacturing and construction, but a cooling in manufacturing vs. continued trend growth to a slight deceleration in construction.  In both cases this means gains of less than 30,000, and possibly as low as 5,000. Because the economy is slowing, and this should show up in jobs numbers, if there is a surprise in either or both, it will likely be to the downside.

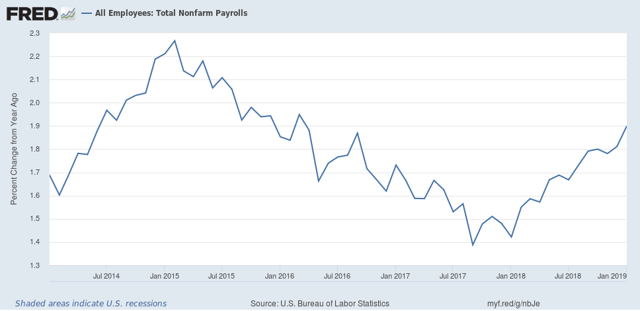
Finally, I expect YoY overall jobs growth to begin to decelerate from its peak last month:


which means a gain of fewer than 200,000:

We’ll see tomorrow.

Wednesday, March 6, 2019

This Friday, watch out for an outright decline in temporary employment


 - by New Deal democrat

Almost a month ago I flagged the decelerating staffing index, and showed how it corresponded with the leading sector of temporary jobs in the monthly jobs report:
the Staffing Index isn’t seasonally adjusted, [so] you really have to compare each on a YoY basis. And while the two don’t turn positive or negative at the same time or for the same duration, they do correlate well on YoY direction; i.e., acceleration or deceleration in the YoY comparison.
I concluded:
[This deceleration] makes me think that the deceleration of temp jobs in the monthly report for the last three months, as shown in the final graph below:
hasn’t just been noise, but - while still positive - is demonstrative of real weakness. 
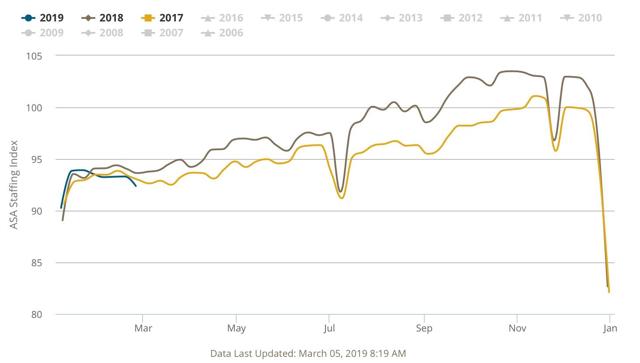
Since then, beginning three weeks ago, the Staffing Index has gone negative. As of this week, it is down over -1% from a year ago, and even negative compared with two years ago:

As a result, I expect at minimum that this Friday’s employment report will show that temporary help jobs have also decelerated YoY. Since in  last February 12,000 temp jobs were added, that isn’t much of a constraint.

But the average for the last three months has been declined to +3,000 per month. With the Staffing Index having continued to roll over since the beginning of this year, that is a more realistic ceiling on what I am expecting on Friday, and there’s probably a 50/50 chance of an outright decline will be reported for February.
The bottom line is that almost all of the other economic data has been validating the “slowdown” forecast I made beginning last summer, and I expect employment to follow — and temporary jobs will probably lead the way.

Tuesday, March 5, 2019

February services index strong; new home sales in line with bottoming scenario


 - by New Deal democrat

Just a quick note on this morning’s economic data.

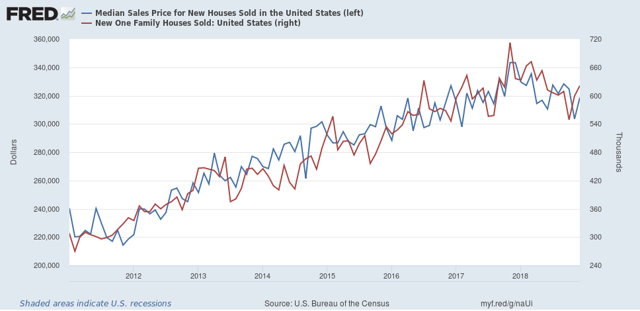
First, new home sales improved in December from October and November’s relatively dismal pace (blue in the graph below). We are back to the levels of last summer, but still down from one year ago (including as the more stable, less noisy 3-month rolling average)(red shows prices, which have been moving in tandem with sales during this expansion): 


This is of a piece with yesterday’s December permits and starts data. Both metrics are down, but look likely to bottom within a few months in response to lower long term interest rates.

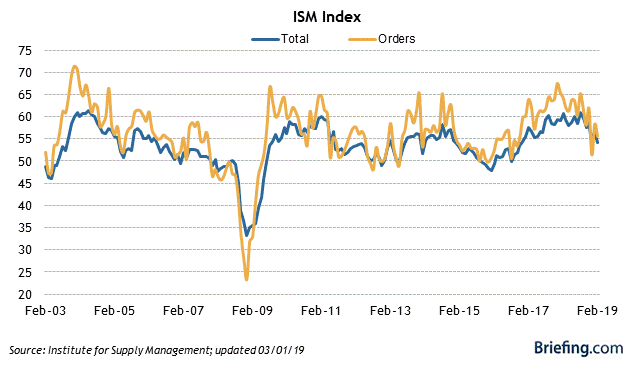
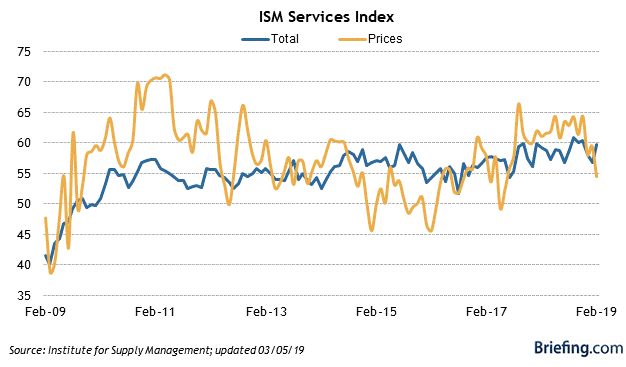
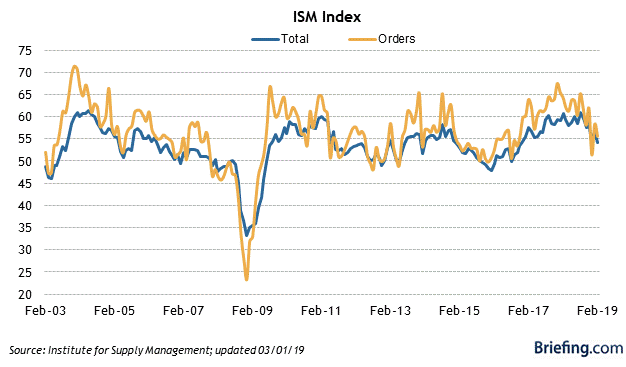
Second, the ISM services, or non-manufacturing, index came in at a very good 59.7. Here is that metric for this expansion (via Briefing.com):


As you can see, this metric is doing very well.

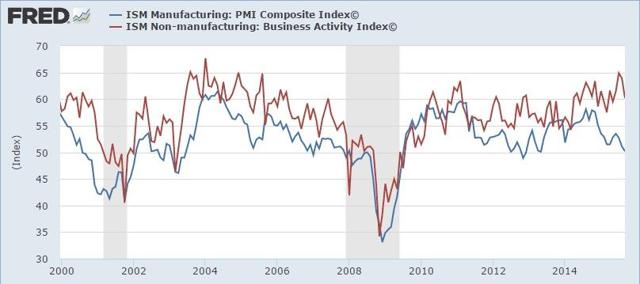
ISM doesn’t let FRED publish their data any more, but fortunately there are long-term graphs since the beginning of the series 20 years ago that are still around. Here’s one from 5 years ago, comparing services with manufacturing:


The important thing here is that, unlike the manufacturing index, which is a leading indicator, services are a coincident, and possibly even lagging indicator (look at 2008). If and when ISM services slips to 50, that will probably mean that a recession is imminent or has already started.  But no worries for the moment!

Monday, March 4, 2019

Residential construction declines in December, but looks to be bottoming


 - by New Deal democrat

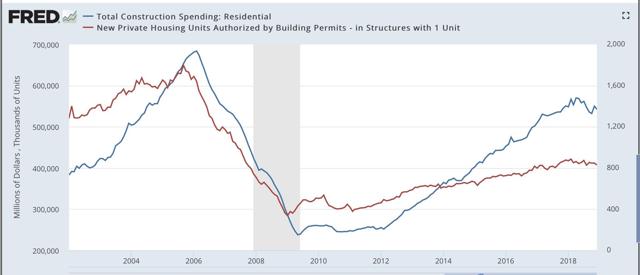
Residential construction spending lags sales, permits, and starts. But it still leads the economy overall, and it is a much smoother data series, with little noise. It is almost all signal, and so it is an important confirmation of the more leading data.

In December, residential construction spending did decline vs. November and also vs. one year ago, but it was higher than September’s and October’s numbers. 

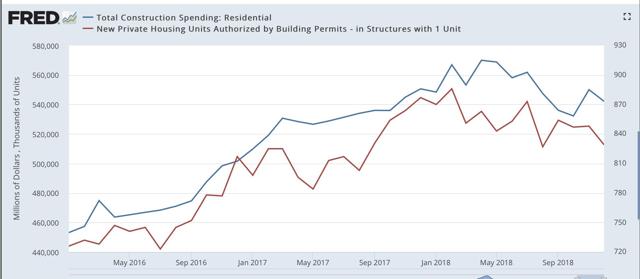
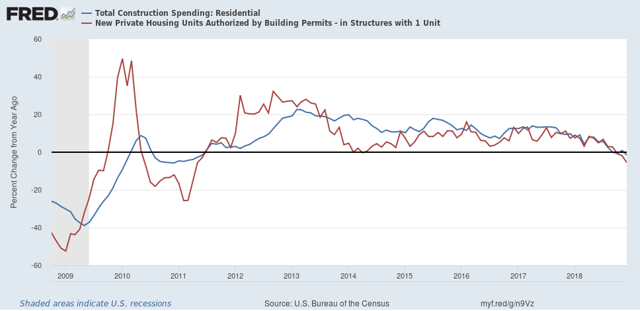
Let’s go to the graphs. Here’s the absolute level of residential construction spending (blue) vs. single family permits (red), first a long term look, and then focusing on the last several years.  As usual, I choose single family permits because they are the least noisy of all the more leading data:


That permits lead construction is easy to see. In the second graph, the declining trend in 2018 with construction following permits with a brief lag is also apparent.

Here is the same data as YoY% changes since the bottom in 2009:


Both series are down YoY.

That neither series has made new lows in several months is encouraging. Although I think there is a little further to go in the next few months, Unless the Fed surprises nearly everybody and raises rates again, I strongly suspect that the bottoming process in new home building is ongoing. 

December housing summary at Seeking Alpha


 - by New Deal democrat

I haven’t done a comprehensive update on housing in a few months, in large part because of the lapse in data during the government shutdown.

With last week’s report on December housing permits and starts, plus several house price indexes, I put up an update over at Seeking Alpha .

As usual, clicking over and reading should be educational for you, and helps me with a bit of $$$.

Also, we’ll get December construction spending later this morning, and new home sales tomorrow. I’ll update further as warranted once these (especially spending) are reported.

Sunday, March 3, 2019

Climate change is the detonation of the Population Bomb


 - by New Deal democrat

You know the drill ... it’s Sunday so I speak my mind on things non-economic.....

Way back in the days of the dinosaurs when I was a young teen, I concluded that there were really only two extinction level threats to humanity:
1. Nuclear war 
2. Overpopulation (a/k/a “The Population Bomb”)

As to the first, fortunately we have gone over 70 years since Hiroshima and Nagasaki. But I find it difficult to conclude that unless something changes, over a long enough time horizon, like 500 years, a nuclear war won’t happen. Just consider the likes of Donald Trump and Kim Jung Un with their fingers on the button, and wonder how long till someone like them makes a fatal mistake.

As to the second, we have the example of Easter Island, where the last tree is cut down, and the last food-source is exhausted. Humanity disappears.  All you need to consider is whether the Easter Island experience can be scaled up to the entire planet.

I have thought a lot recently about climate change, and increasingly think it is ultimately a manifestation of the Population Bomb.

I am currently reading historian Yuval Noah Harari‘s “Sapiens: a Brief History of Humankind.”  I’m not sure if the book as a whole is very recommendable. Much of it comes across as broad-brush sociological speculation, some of it provocative (e.g., money is the most universally accepted part of human culture. One culture may hate another, but will universally be willing to trade in their accepted coin or currency.), and some of it flimsy (e.g., why patriarchies are much more common than matriarchies). Perhaps the most interesting observation is that what sets humans apart from other social animals is our willingness to cooperate on both an individual and massive scales with complete strangers. A look at human population growth shows just how successful that has been.

The first modern human, our “Eve,” lived about 200,000 years ago. Probably the genetic mutation that she spawned was the dropping of the voice box further into the throat, enabling speech (as opposed to, e.g., grunts or gestures). So magical was the ability to speak that those endowed with it - the new human species - expanded through Africa and then ultimately out of it to Europe and Asia about 70,000 years ago.

What does that have to do with climate change and overpopulation? According to Harari, along the way, something alarming happened. 
 - About 45,000 years ago, humans arrived in Australia. Shortly thereafter, almost all of the large predator and prey species went extinct.
 - About 16,000 years ago, humans arrived in the Americas. Shortly thereafter, almost all of the large predator and prey species went extinct.
 - About 800 years ago, humans arrived in New Zealand. Within 200 years,  most of the large predator and prey species were extinct.

(As an aside, it’s possible that humans had a partner in crime in these extinctions.  Below is a still of the last frame of the move “Alpha,” a fictional account of the first wolf that partnered with a human:


I don’t know about you, but if I were a prey animal and I saw a combined human-wolf-pack like that coming at me, I would be thinking, “Oh, sh#t! We are SO dead!” The evidence is that wolves were domesticated long before humans settled into agricultural communities, so almost certainly hunting as a team had something to do  with it.)

But that’s not the point. The widespread extinctions of “megafauna” that coincided with the arrival of modern humans on the scene is just one example of the global impact of the “anthropocene” epoch.

Here is a graph of the entire world population over the past 7000 years:
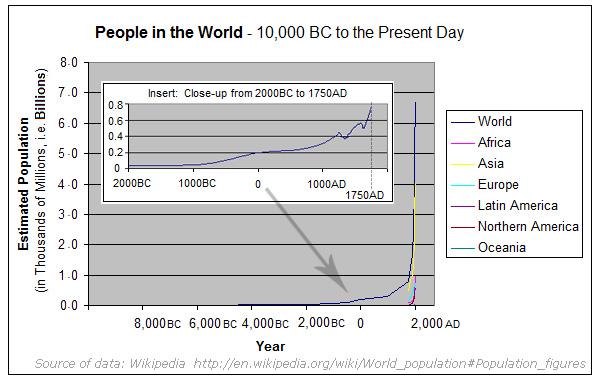
 

But this is a case where a chart might is even more devastating, as in the below, which based on figures cited by Harari and others, is what human population growth has looked like ever since that first “Eve” 200,000 years ago:

Years ago.     World population   doubling rate
200,000                      1
 75,000              80,000
 12,000         8,000,000  ~10,000 years
   3,000       80,000,000     ~2800 years
      200     800,000,000       ~850 years
Present  8,000,000,000         ~60 years

Not only has the human population exploded in raw terms, but its rate of growth has actually been accelerating ever since the “agricultural revolution” that began roughly 12,000 years ago.

Meanwhile, the last megafauna on the planet, like Siberian Tigers and African Elephants, teeters on the edge of extinction. Two thousand years ago megafauna that we associate with sub-Saharan Africa was also present along the temperate region along the Mediterranean coast. It disappeared via the Roman Coliseum. A little over 100 years ago, partly as an effort to exterminate the Indian tribes, American buffalo were hunted down to about 400. Now we are busy driving even ocean life, for example cod and lobster, towards extinction.

As these resources decline, their cost increases dramatically. Two hundred years ago lobster was junk food. Caspian Sea caviar costs a year’s salary. And need we talk about the concept of “peak oil”?

Just in the last year, evidence was adduced that possibly the death of up to 90% of Native North and South American tribes due to diseases introduced from Europe after 1492 caused so much re-forestation that it contributed to the “Little Ice Age.”

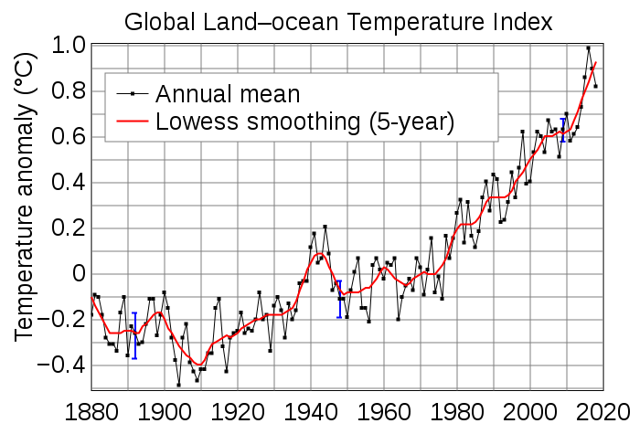
And so now we come to global warming. Here’s a graph of average ocean temperatures in the past 150 years:


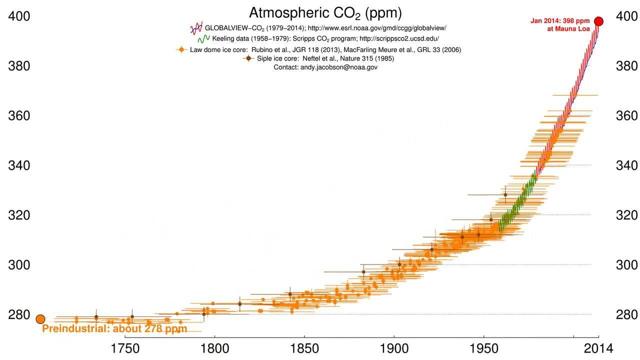
And here is carbon dioxide levels in the atmosphere for the past 300 years:


Does anyone seriously think that the half measures and quarter measures being contemplated — and fiercely opposed — are going to make a meaningful dent in the trend in those two graphs?

The simple fact is, humanity has been slowly — but at an accelerating rate — turning the entire planet into Easter Island. I strongly suspect that we have already crossed the threshold beyond the Earth’s long term carrying capacity for the human race. The planet could handle 8 million, 80 million, and even 800 million humans without widespread damage. There is evidence everywhere in the animal, ocean, and atmospheric environment that it can’t handle 8 billion humans for long.

Want to defeat climate change? A global one-child policy for two generations, bringing total human population down to where it was in about 1950 might be enough. It almost certainly will never happen.

But if human population has already exceeded the carrying capacity of the planet, humanity will get there, willingly or not.        
Saturday, March 2, 2019

Weekly Indicators for February 25 - March 1 at Seeking Alpha


 - by New Deal democrat

My Weekly Indicators post is up at Seeking Alpha.

Last year the most significant developments were in the long leading indicators. Now that is translating into the short leading indicators.

As always, clicking and reading not only should be educational for you, but rewards me a little bit for my efforts.

Friday, March 1, 2019

Manufacturing holds on in February


 - by New Deal democrat

The theme for most reports remains that the government shutdown in December and January, plus a 30 year record cold snap for a week in January, put a real dent in the economy. That certainly was the message of December personal spending and December and January personal spending this morning.

But it looks like there was no significant damage to manufacturing. This week three regional Fed banks reported February manufacturing in their region, followed by the Chicago PMI, and finally ISM manufacturing this morning.

At the end of January, the average new orders reading of the five regional Feds was +5. After much storm and drang, notably a big downdraft in the Kansas City region, but an even bigger updraft in Richmond, the average for February increased +1 to 6.

One regional Fed that does not report is Chicago, but the Chicago PMI’s new orders index, which has been running hotter than the other regional reports for months, also bounced back strongly in February, from 53.2 to 68.4 (which is still not quite as positive as it was for a number of months earlier last year). Subtracting 50 to make this compatible with the Fed indexes gives us an increase in the average from +5 in January to +10 in February.

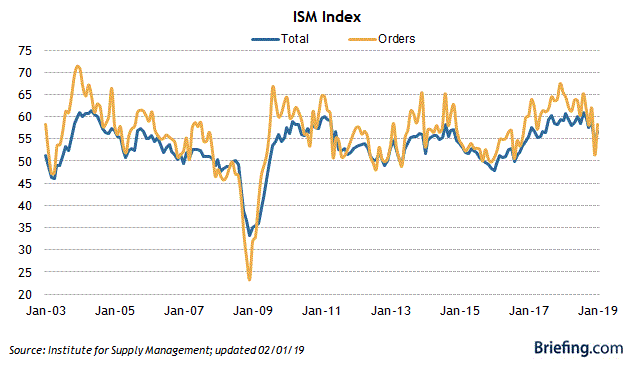
Finally, this morning the ISM new orders index for February declined to 55.5 from January’s 58.2 reading. The total index declined from 56.6 to 54.2, the lowest in nearly two years (h/t Briefing.com):


This of course is still well into positive territory, and in line with most of this expansion. It is also in line with the average of the regional Fed reports. Chicago looks like the outlier.

The bottom line remains that manufacturing is decelerating from its torrid pace last summer, but is still expanding decently. Because I anticipate further slowing in the economy over the next 6 to 9 months, I am still expecting further deceleration in manufacturing. Whether it goes beyond that into outright contraction is very much an open question.

Thursday, February 28, 2019

Initial claims not at cautionary levels yet


 - by New Deal democrat

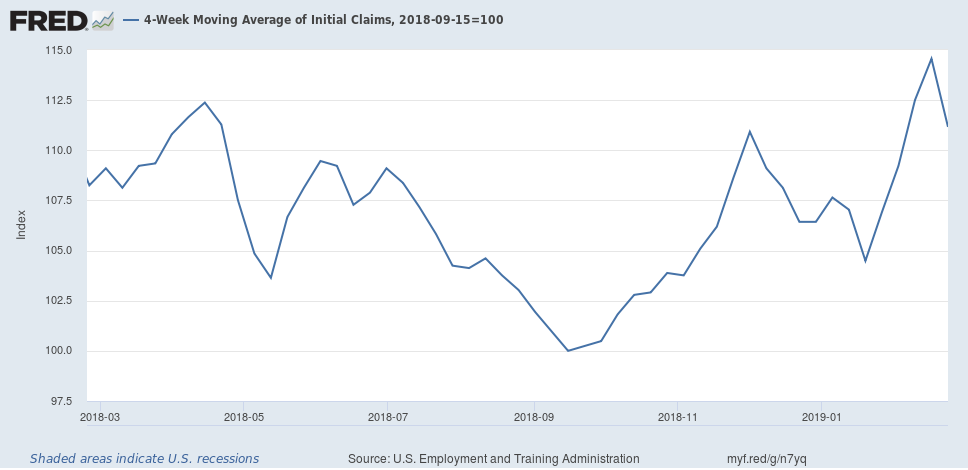
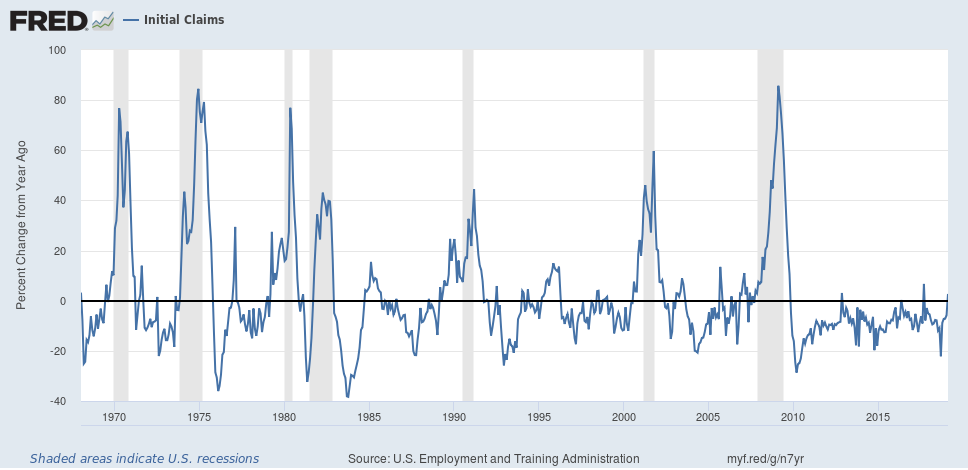
Initial jobless claims are an important short leading indicator, typically turning up 3-9 months before a recession. A problem is the necessity of filtering out signal from noise.There are two ways I measure claims in order to do so: (1) how much has the less noisy four week average risen from its low? And (2) have initial claims, averaged monthly, turned higher YoY?

Let’s start with the first measure. A 10% increase off of an interim low in claims is not unusual, and has happened every year or two for the entire 50+ year period that records have been kept. By the time they are up 15% from their bottom, not only is it almost always a signal of recession, but frequently the recession is imminent.
To distill signal and still give reasonable warning, the caution signal I employ is a rise of over 12% from a low. Measuring so, we see that initial claims as of this week are up about +11.5% off their lows:
Note that I am discounting the previous few weeks because they were distorted by layoffs due to the government shutdown. The four week average now does not appear to have any special factors.
Next, here is the long view of initial claims YoY measured monthly:
In any given expansion, there is usually at least one month where claims are higher YoY. But if that happens for two months in a row, more often than not it has signaled that a recession is approaching.
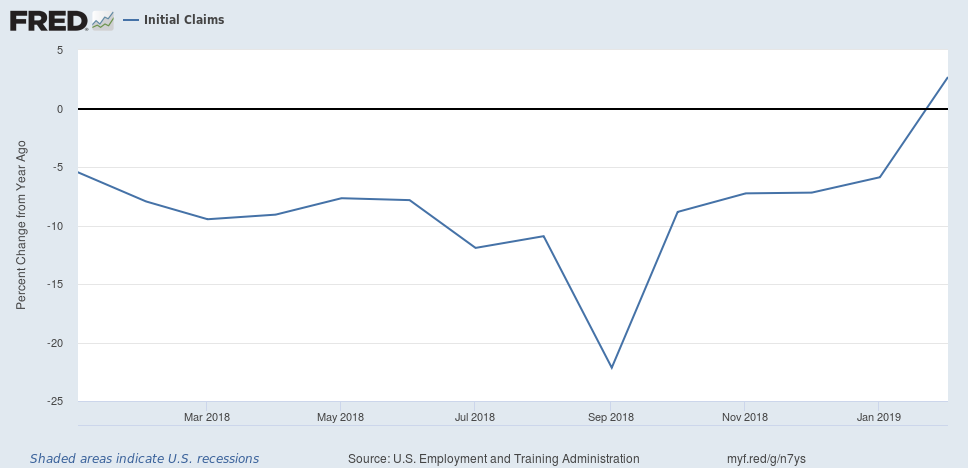
Here is what all of 2018 plus the first two months of 2019 look like:
Note that the big distortion in claims happened at the end of January. Even so, on average January 2019 was lower than January 2018. But February saw more initial claims being filed on average than one year ago. Still, we won’t have a caution signal unless March also sees higher claims than March of last year.

The bottom line is that, while initial claims are close to the levels at which they would give a warning, they aren’t quite there at this point.

Q4 GDP: mixed signals for the future (UPDATED with graphs)


 - by New Deal democrat

I didn’t post anything yesterday, so I’ll make up for it with two posts today.

This morning we finally got the very delayed first look at Q4 GDP. As per my usual practice, I am less interested in what happened in the rear view mirror, which was an annualized gain of +2.6%, than what the number tells us about what lies ahead.

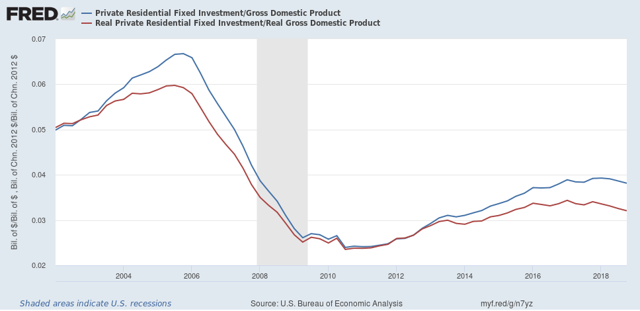
The two forward-looking components of GDP are (1) private fixed residential investment, and (2) corporate profits. Both of these are long leading indicators, I.e., giving us an idea about where the overall economy will be a year or more out from here.

In that regard, the news was mixed.

Private residential fixed investment declined -0.9% q/q. This is in keeping with the downturn in housing construction that we have seen in the monthly data. Note that residential investment as a share of GDP declined in both nominal (blue) and real (red) terms:


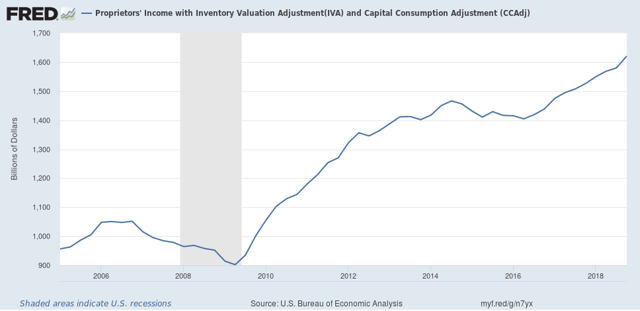
Meanwhile, corporate profits as is usual won’t be reported until the final revision in GDP one month from now, but proprietors’ income rose, was. While it does not always move in the same direction as corporate profits, and sometimes lags, it a good placeholder.  Here the news was positive, as proprietors’ income rose +2.6% q/q:


I’ll supplement the above with graphs later. (UPDATE: DONE)

 But the takeaway is, that in the rear view mirror, there was no recession in Q4. While one important leading sector of the economy, housing, continued to deteriorate, the producer side of the economy in the form of proprietors’ income, kept humming along. While enough long leading indicators of the economy did decline in 2018 to continue to justify being on “recession watch” for later in this year, and particularly Q4, there is no sign of deterioration on the producer side of the economy, so if a recession does develop, it will likely be centered on consumers and secondarily on manufacturing.

Tuesday, February 26, 2019

December housing permits and starts mixed, support slowdown scenario


 - by New Deal democrat

This morning we finally got December housing permits and starts. Remember that starts are more volatile than permits, and single family permits are the least volatile of all.
  
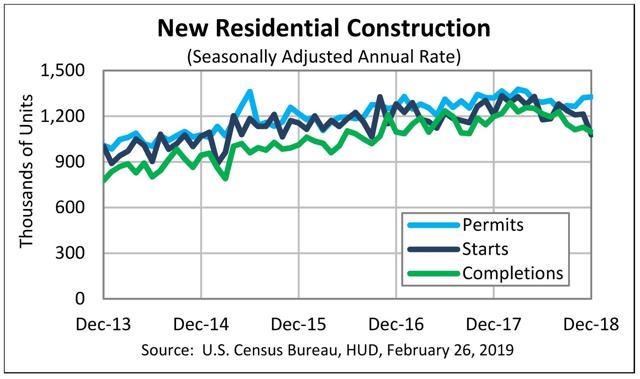
Here’s what the overall data looks like:

While starts and completions laid an egg, permits actually went up a little bit.
In particular, for housing to be outright recessionary, I would want to see single family housing permits down -10% from peak at minimum. This morning’s data has them down only about -6.5% off peak, just slightly above their worst showing of 2018.
In other words, this morning’s report says slowdown rather than recession to me.
On a side note, the talking heads on CNBC were bemoaning that lower mortgage rates hadn’t led to an substantial increase in housing starts. But as I’ve pointed out many times, permits and starts follow interest rates with about a 3 to 6 month lag. In other words, consistent with a bottom in housing construction this spring.
I’ll have more to say probably tomorrow at Seeking Alpha. When the post goes up, I’ll link to it here. 

Monday, February 25, 2019

At last! Missing long leading metrics and manufacturing in the spotlight this week


 - by New Deal democrat

This week manufacturing and some important data long delayed by the government shutdown will be in the spotlight.

First, manufacturing: as the below graph of ISM manufacturing and new orders shows, in the last 8 months, manufacturing has slowed from white hot expansion to just weakly positive:


As of last Friday, the rolling average for new orders in the five Fed regional indexes was just +1 above completely stalled — it had been as high as +28 in spring 2018!

Between today and Thursday, three remaining Fed regions — Richmond, Kansas City, and Dallas— will report their February manufacturing indexes. Also on Thursday, the Chicago PMI gets published. That one has been the most positive of any region for the past year.  Finally, on Friday ISM publishes its national February manufacturing report.

It’s possible that by the end of this week we will have evidence that manufacturing is in outright contraction. We’ll see.

Meanwhile, data on three long leading indicators — building permits, residential investment, and proprietors’ income — that have been delayed by as long as two months, finally get reported, on Tuesday (permits for December) and Thursday (as part of the Q4 GDP report).

A couple of weeks ago I went ahead and made a “preliminary” forecast for the second half of 2019, using substitutes for this data, that included me going on “Recession Watch” for Q4 of this year. The missing data, once reported, could either consolidate or alleviate that forecast.

Saturday, February 23, 2019

Weekly Indicators for February 18 - 22 at Seeking Alpha


 - by New Deal democrat

My Weekly Indicators post is up at Seeking Alpha.

The short leading indicators have sunk to a level that is consistent with an oncoming recession in the next 3 - 8 months.  But the recent government shutdown may still be skewing some of the data.

As always, not only is clicking and reading hopefully informative for you, but it also helps reward me a little bit for the effort I put in to this work.

Friday, February 22, 2019

Housing may bottom this spring


 - by New Deal democrat

Despite yesterday’s poor existing home sales report, which was the worst in over three years, the bottom in housing may be near.

This post is up at Seeking Alpha. As always, reading the post should be helpful to you, and renumerates me just a bit for my efforts.

Thursday, February 21, 2019

Industrial transportation stalls out


 - by New Deal democrat

The two main forms of transporting goods, rail and trucking, have both gone negative YoY, and on average over the last 3+ months are only slightly better than zero. This both has implications for the broader economy, and confirms some other poor data.

This post is up at Seeking Alpha.

Wednesday, February 20, 2019

100 years of industrial production


 - by New Deal democrat

This is a post that can literally be written only once in 100 years!

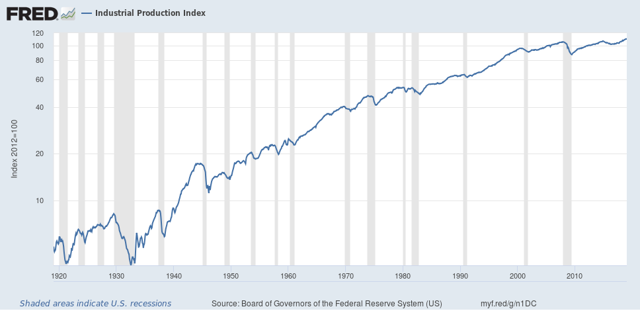
Because as of last Friday, it has been exactly 100 years since the first publication of industrial production by the Fed in January 1919. So this is a good time to take a sweeping historical look at production in the United States.

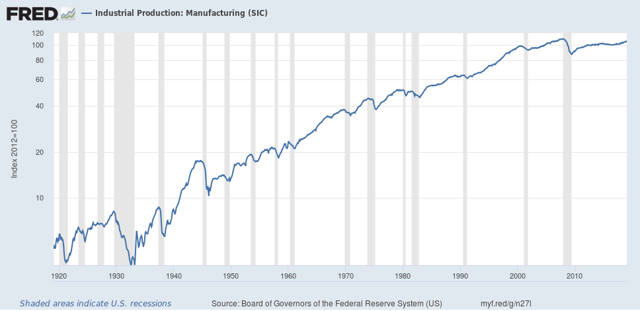
The first graph below is the entire 100 year history, on log scale so that equal percentage changes in each time period are calibrated equally:
A few features stand out: the Great Depression, the World War 2 boom, and two downshifts in the long term trend: first in the 1970s-1999, and second from 1999 to the present.

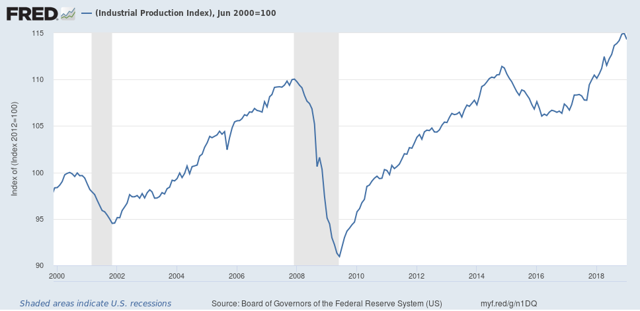
In fact, the past 20 years have been the slowest secular period since publication of industrial production started 100 years ago. As shown in the below graph, normed to 100 in June 1999, production has only grown 15% in the 20 years since. It grew just under 10% during the 2000s expansion, and only about 5% in the last 11 years:

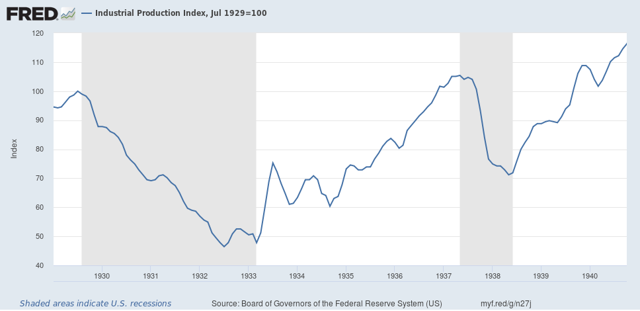
The worst previous period was the 1929-37 portion of the Great Depression, but even there production grew 6% by the end of that 8 year period, and exceed a 15% gain from 1929 by late 1940, 11 years later:

The situation is even worse when we subtract mining and utilities, and focus just on manufacturing. Here’s the 100 year log scale growth in that sector:

Note that growth has for all intents and purposes stopped since 1999.

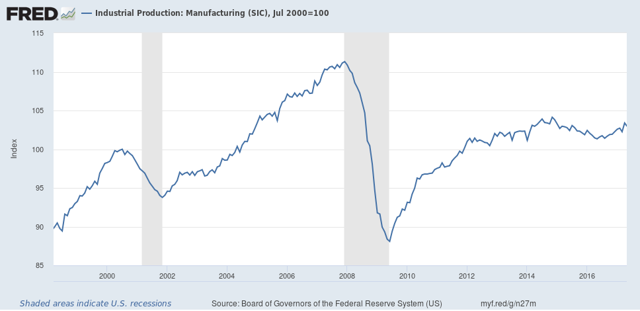
Again focusing just on the last 20 years, we see that manufacturing production grew just 11% during the 2000s expansion, and even now 11 years later, has still not equaled the 2007 peak:
Total growth over the last 20 years in manufacturing has been just 3.4%.

Taking the long historical view shows the relative — and in the last decade, absolute — decline of the US as a manufacturing power. And it also puts paid to the notion that, at least in the last 20 years, the decline in manufacturing employment is mainly about productivity and mechanization. If it woeren’t for the rebirth of “Saudi America” in the energy sector over the last 10 years, industrial production growth in the US would have completely stopped.

Tuesday, February 19, 2019

Wages continued to improve through January


 - by New Deal democrat

One item I didn’t get around to in the last couple of weeks is how wages performed as of January’s jobs report. And the basic answer is: pretty good!

The first graph below shows real, inflation adjusted average wage gains for non-managerial workers measured YoY:
As of January they were up +1.9%. This is the best showing except for a few months in 2015.
As Jared Bernstein has shown, the “real” gains in wages have a lot to do with the price of gas (blue in the graph below). But in the last two months they have risen the most in the last 8 years in real terms ex-energy:
So average workers are finally making some real headway.

By the way, this also shows up in the Q4 2018 Employment Cost Index that was released three weeks ago:

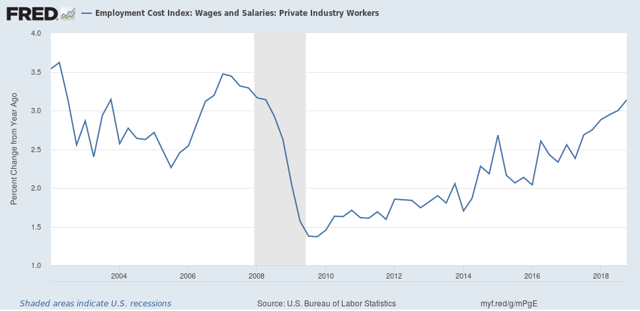
The ECI measures *median* wages, i.e., the 50th percentile level, and so does away with the “Bill Gates enters a bar” problem. At +3.1% YoY, this is the best showing since late 2006-early 2008.

Returning to real inflation adjusted average wages, they improved again and are now only 3% below their 1973 peak:

Finally, total wage growth for non-managerial workers since the bottom in October 2009 is now up +28.5%:

Total wage growth from this entire expansion has only been exceeded by the 1960s and 1990s expansion. The bad news, of course, is that it took 9 years to get here.

Monday, February 18, 2019

It’s Presidents Day, and we’re still basically flying blind on the eoncomy


 - by New Deal democrat

Not only are the markets closed today for President’s Day, but this entire week is about the emptiest I can ever recall for economic data. Literally the only data of note is going to be released on Thursday, and except for weekly jobless claims, even that is not what I would generally consider first-order metrics.

Even worse, we are still basically flying blind due to the government shutdown. The only data of note that had been on hiatus, and has been updated since it ended was last week’s retail sales for December. And that report was jarring enough to justify worrying that not only did the shutdown make us economically blind, but it itself may have further weakened an already weakening economy. So we may be in for some more jarring surprises when December housing starts and permits, December income and spending, and Q4 GDP finally get released next week.

There are a couple of series I’ve been meaning to update, so maybe I’ll get around to them. But, don’t be surprised if I don’t post any material for a day or two, or post a brief note on a political topic.