Sunday, December 4, 2011
Morning Market
Last week, oil's primary price movement occurred on Tuesday and Wednesday, when prices made an equal move higher -- they advanced on Tuesday morning, consolidated Tuesday afternoon and Wednesday morning, and then advanced an equal distance on Wednesday. Interestingly, prices did not advance strongly on Friday when the unemployment report was printed, instead staying below the 101/101.5 level.
On the daily chart, we see the EMAs printing a very bullish outlook, but prices are still between two important levels, indicating we'll probably see consolidation for the next few weeks as traders get a better idea for the overall macro-level economic direction.
Pulling the lens back, we see the dollar was clearly in a downtrend and head and shoulders formation for 2010. The downtrend was caused by the Fed's 0% interest rate policy and massive fiscal stimulus. However, for the last few months, the dollar has benefited from being the "least dirty shirt in the hamper" -- especially in relation to the euro. As such, we're seeing prices consolidate at the bottom of the downward trend. There are two important lower levels to keep in mind -- 21 (which is right below the current lower trend line) and the lower trend line itself.
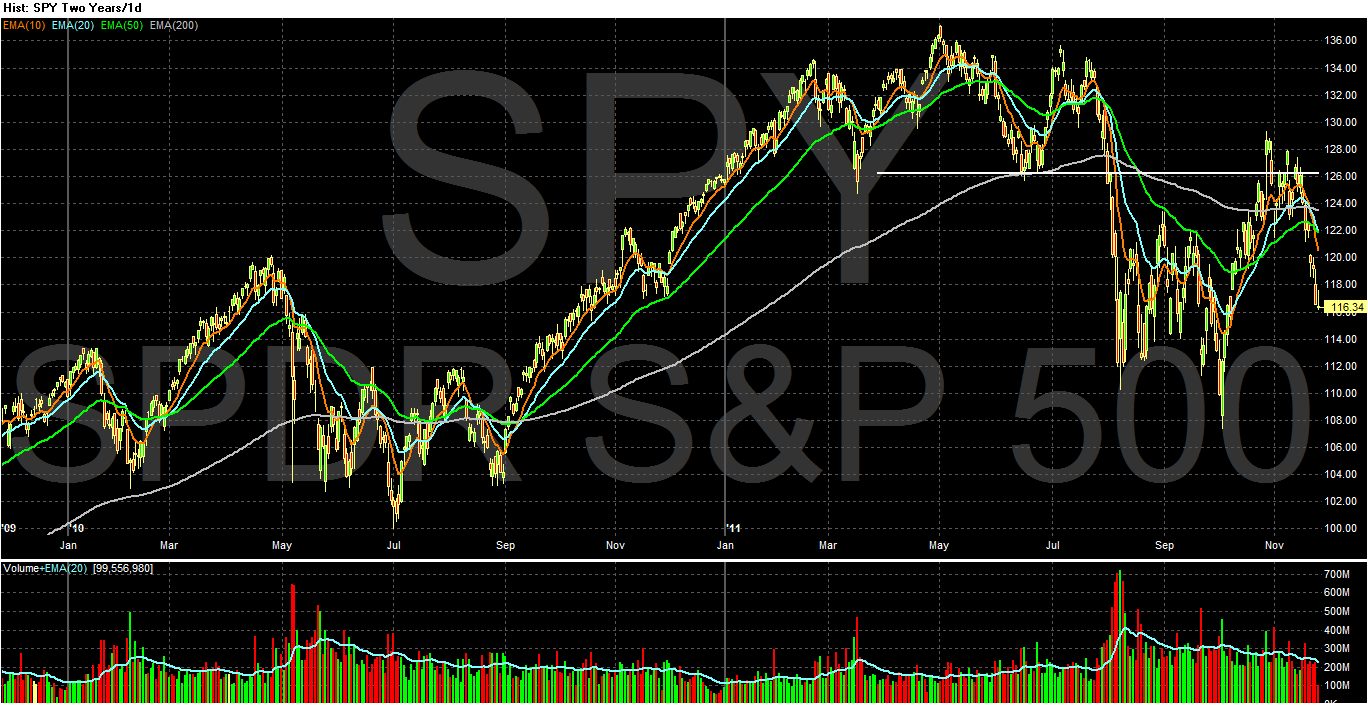
The above chart is a six day chart of the SPYs. Prices gapped higher on Monday, consolidated for two days, then gapped higher on Wednesday due to the coordinated central bank move. However, Prices did not move higher on Friday in response to the employment report. Some of that may be due to the strong rally prices saw all week. But, there were some very good points to the employment report which were economic positives.
The daily chart shows that prices are still in a consolidation trend. And even though we had a good jobs print on Friday, prices did not follow through on the rally to break out of the consolidation trend. Instead, prices fell back within the symmetrical triangle.
Saturday, December 3, 2011
Weekly Indicators: Asking prices for houses turn positive YoY edition
- by New Deal democrat
The big monthly number was yesterday's employment report, showing 120,000 jobs added to the economy in November. September and October were also revised up by a total of 72,000, conintuing the string of upward revisions. The household survey was even more impressive, up 278,000 jobs. The last 4 months in this survey have shown gains averaging 321,000 a month. Unemployment declined to 8.6%, the lowest since March 2009. Only half of the 0.4 decline was due to participants leaving the workforce, as to which the phrase "retiring baby boomers" assumes ever-increasing importance. Two important internals were weak: manufacturing hours, one of the 10 LEI, declined by .2. Wages actually decreased by $.02 continuing the ominous real wage deflation of this year.
In other monthly news, manufacturing improved (although vendor deliveries, another of the LEI, decreased). Auto sales were up, and at their strongest level ex cash for clunkers since August 2008. Consumer confidence rebounded strongly, taking back over half of its decline since the end of June. New home sales were flat, and the Case-Shiller index of home prices declined more than expected, althought its YoY% decline continues to lessen.
Before turning to the high frequency weakly data, let me remind new readers that this post is not designed to be a "big picture" look at the economy. Quite the reverse: if we think of the economy like a motion picture with 24 frames per second, this post compares the most recent frame with the frame just preceding. In other words, it is a snapshot of as close as we can get to the present moment. Before any change in direction in monthly data is confirmed by two successive reports, there will be at least 8 weekly datapoints, which will show the change first.
Let's start with the small sea-change in housing. For the first time since the inception of the series over 4 1/2 years ago, YoY weekly median asking house prices from 54 metropolitan areas at Housing Tracker were positive, up +0.1% YoY for the last full week of November. The areas with YoY% increases in price decreased by 1 to 20. Only Chicago continued to have a double-digit YoY% decline. The monthly number for all of November was still down -0.7% YoY, which is still the smallest monthly YoY decline since the series began. Housing Tracker's asking prices have generally led sales prices at turning points and in the second derivative by 4 to 6 months over the history of the series, so this suggests that the Case-Shiller index YoY decrease will continue to lessen in coming months, and may turn positive nominally by next summer.
Meanwhile, the Mortgage Bankers' Association reported that seasonally adjusted purchase mortgage applications decreased -0.5% last week. On a YoY basis, purchase applications were down -8.2%. This primarily reflects a multi-week spike last year vs. flatness this year. The actual reading remains firmly within the range that purchase mortgage applications have been in since May 2010. Refinancing fell -15.3% w/w. Refinancing continues to be extremely volatile.
Turning to jobs, the BLS reported that Initial jobless claims rose 9000 to 402,000. This is 14,000 above the 388,000 low of 2 weeks ago. The four week average rose 1500 to 395,750.
The American Staffing Association Index remained at 92 last week. This series continues its slight upward trajectory, but remains slightly below last year's levels.
Tax withholding for the 20 reporting days of November was significantly down from last year's levels. Adjusting +1.07% due to the 2011 tax compromise, the Daily Treasury Statement showed that for this November, $135.5 B was collected vs. $138.9 B a year ago, a decline of -2.4 B. Before concluding that the economy has suddenly weakened, however, note that this November began on a Tuesday whereas November 2010 began on a Monday. That means that this November only had 4 Mondays vs. last November's 5. Tax collections are typically stronger on Mondays and much stronger on the first of the month. Usually the 20 day moving average takes care of that issue (4 x each weekday), but because of holidays in November, that didn't apply. When I correct for this by measuring 20 days beginning Monday October 31, 2011 or Tuesday November 2, 2010, the anomaly disappears, and tax collections for the 20 day period are up $1.8 B or $1.7 B respectively, or about +1.3% YoY.
Retail same store sales remained positive as they have been all year. The ICSC reported that same store sales for the week of November 26 increased 4.0% YoY, and 1.7% week over week. Shoppertrak reported that YoY sales rose 4.4% YoY.
The American Association of Railroads reported that total carloads increased 3.9% YoY, up about 17,000 carloads YoY to 456,200. Intermodal traffic (a proxy for imports and exports) was up 6700 carloads, or 3.7% YoY. The remaining baseline plus cyclical traffic increased 10,200 carloads or 4.0% YoY. Total rail traffic has staged an impressive rebound in the last couple of months.
Money supply continues to stabilize after its Euro crisis induced tsunami. M1 decreased -0.5% last week, and is up a slight 0.2% month over month. It remains up 18.7% YoY, so Real M1 remains up 15.1%. This is about 5% under its peak YoY gain several months ago. M2 also decreased -0.4% w/w. It remained up 0.3% m/m, and 9.4% YoY, so Real M2 was up 5.8%.
Weekly BAA commercial bond rates declined .05% to 5.11%. Yields on 10 year treasury bonds fell even more, down .08% to 1.94%. In the last couple of weeks, spreads have started to widen again, representing increasing weakness.
Finally, the Oil choke collar is tightening, as Oil closed just below $101 a barrel on Friday. This about $6 above the recession-trigger level calculated by analyst Steve Kopits. Gas at the pump, however, decreased $.06 to $3.31 a gallon. Measured this way, we probably are only about $.05 to $.10 above the 2008 recession trigger level. Gasoline usage was off YoY, but by considerably less, at 8769 M gallons vs. 8867 M a year ago, or -1.1%. The 4 week moving average is off -2.9%, which is also less of a decline compared with recent weeks.
With the vital exception of real wage deflation, the picture now is very similar to that of a year ago. Having dodged a double-dip recession, the economy then showed signs of becoming a self-sustaining recovery, only to be strangled by the Oil choke collar (with an assist by the tsunami in Japan) in March. It looks like we've dodged another bullet, but the Oil choke collar is tightening again.
Have a nice weekend.
The big monthly number was yesterday's employment report, showing 120,000 jobs added to the economy in November. September and October were also revised up by a total of 72,000, conintuing the string of upward revisions. The household survey was even more impressive, up 278,000 jobs. The last 4 months in this survey have shown gains averaging 321,000 a month. Unemployment declined to 8.6%, the lowest since March 2009. Only half of the 0.4 decline was due to participants leaving the workforce, as to which the phrase "retiring baby boomers" assumes ever-increasing importance. Two important internals were weak: manufacturing hours, one of the 10 LEI, declined by .2. Wages actually decreased by $.02 continuing the ominous real wage deflation of this year.
In other monthly news, manufacturing improved (although vendor deliveries, another of the LEI, decreased). Auto sales were up, and at their strongest level ex cash for clunkers since August 2008. Consumer confidence rebounded strongly, taking back over half of its decline since the end of June. New home sales were flat, and the Case-Shiller index of home prices declined more than expected, althought its YoY% decline continues to lessen.
Before turning to the high frequency weakly data, let me remind new readers that this post is not designed to be a "big picture" look at the economy. Quite the reverse: if we think of the economy like a motion picture with 24 frames per second, this post compares the most recent frame with the frame just preceding. In other words, it is a snapshot of as close as we can get to the present moment. Before any change in direction in monthly data is confirmed by two successive reports, there will be at least 8 weekly datapoints, which will show the change first.
Let's start with the small sea-change in housing. For the first time since the inception of the series over 4 1/2 years ago, YoY weekly median asking house prices from 54 metropolitan areas at Housing Tracker were positive, up +0.1% YoY for the last full week of November. The areas with YoY% increases in price decreased by 1 to 20. Only Chicago continued to have a double-digit YoY% decline. The monthly number for all of November was still down -0.7% YoY, which is still the smallest monthly YoY decline since the series began. Housing Tracker's asking prices have generally led sales prices at turning points and in the second derivative by 4 to 6 months over the history of the series, so this suggests that the Case-Shiller index YoY decrease will continue to lessen in coming months, and may turn positive nominally by next summer.
Meanwhile, the Mortgage Bankers' Association reported that seasonally adjusted purchase mortgage applications decreased -0.5% last week. On a YoY basis, purchase applications were down -8.2%. This primarily reflects a multi-week spike last year vs. flatness this year. The actual reading remains firmly within the range that purchase mortgage applications have been in since May 2010. Refinancing fell -15.3% w/w. Refinancing continues to be extremely volatile.
Turning to jobs, the BLS reported that Initial jobless claims rose 9000 to 402,000. This is 14,000 above the 388,000 low of 2 weeks ago. The four week average rose 1500 to 395,750.
The American Staffing Association Index remained at 92 last week. This series continues its slight upward trajectory, but remains slightly below last year's levels.
Tax withholding for the 20 reporting days of November was significantly down from last year's levels. Adjusting +1.07% due to the 2011 tax compromise, the Daily Treasury Statement showed that for this November, $135.5 B was collected vs. $138.9 B a year ago, a decline of -2.4 B. Before concluding that the economy has suddenly weakened, however, note that this November began on a Tuesday whereas November 2010 began on a Monday. That means that this November only had 4 Mondays vs. last November's 5. Tax collections are typically stronger on Mondays and much stronger on the first of the month. Usually the 20 day moving average takes care of that issue (4 x each weekday), but because of holidays in November, that didn't apply. When I correct for this by measuring 20 days beginning Monday October 31, 2011 or Tuesday November 2, 2010, the anomaly disappears, and tax collections for the 20 day period are up $1.8 B or $1.7 B respectively, or about +1.3% YoY.
Retail same store sales remained positive as they have been all year. The ICSC reported that same store sales for the week of November 26 increased 4.0% YoY, and 1.7% week over week. Shoppertrak reported that YoY sales rose 4.4% YoY.
The American Association of Railroads reported that total carloads increased 3.9% YoY, up about 17,000 carloads YoY to 456,200. Intermodal traffic (a proxy for imports and exports) was up 6700 carloads, or 3.7% YoY. The remaining baseline plus cyclical traffic increased 10,200 carloads or 4.0% YoY. Total rail traffic has staged an impressive rebound in the last couple of months.
Money supply continues to stabilize after its Euro crisis induced tsunami. M1 decreased -0.5% last week, and is up a slight 0.2% month over month. It remains up 18.7% YoY, so Real M1 remains up 15.1%. This is about 5% under its peak YoY gain several months ago. M2 also decreased -0.4% w/w. It remained up 0.3% m/m, and 9.4% YoY, so Real M2 was up 5.8%.
Weekly BAA commercial bond rates declined .05% to 5.11%. Yields on 10 year treasury bonds fell even more, down .08% to 1.94%. In the last couple of weeks, spreads have started to widen again, representing increasing weakness.
Finally, the Oil choke collar is tightening, as Oil closed just below $101 a barrel on Friday. This about $6 above the recession-trigger level calculated by analyst Steve Kopits. Gas at the pump, however, decreased $.06 to $3.31 a gallon. Measured this way, we probably are only about $.05 to $.10 above the 2008 recession trigger level. Gasoline usage was off YoY, but by considerably less, at 8769 M gallons vs. 8867 M a year ago, or -1.1%. The 4 week moving average is off -2.9%, which is also less of a decline compared with recent weeks.
With the vital exception of real wage deflation, the picture now is very similar to that of a year ago. Having dodged a double-dip recession, the economy then showed signs of becoming a self-sustaining recovery, only to be strangled by the Oil choke collar (with an assist by the tsunami in Japan) in March. It looks like we've dodged another bullet, but the Oil choke collar is tightening again.
Have a nice weekend.
Friday, December 2, 2011
Unemployment at 8.6%; Jobs Up 120,000
From the BLS:
So putting this all together, we get the following:
More people are working (+278,000)
Fewer people are unemployed (-594,000) -- this number was a little more than twice the number of people employed.
The denominator of the equation decreased.
Overall, not bad. Some of the decrease was actually do to people not being unemployed.
Expect more discussion about the labor force participation rate from this report -- which decreased to 64%. I've discussed this before, but it bears repeating; we're now in an age when baby boomers are retiring -- meaning this number will probably be lower for the foreseeable future (in fact, I would argue the shape of the labor force has fundamentally changed because of this).
Let's move onto the establishment data:
On a scale of 1-10, I'd give this a 5.5.
-------------
NDD here with a few additional comments:
The best news is the continuing upward revisions of past reports. September and October were revised up a total of 72,000. For the last three months, the average gain was 143,000.
The more volatile household survey employment measure showed a gain of 278,000 in November on top of a gain of 277,000 in October. Since the household survey tends to lead at inflection points, these are very good numbers.
While the decline in the labor force will be trumpeted by bearish sites, this is responsible for only half of the .4 decline in the unemployment rate.
There were negatives, though. (1) Average hourly earnings actually decreased $.02. This is another reinforcing shot of real wage deflation. (2) The manufacturing workweek declined 2/10's of an hour. This is one of the 10 LEI, and is a significant negative although it just took back last month's gain. Over a longer period, this series is now trending sideways. (3) Only 2000 manufacturing jobs were added. This leading series is also trending sideways. (4) There was a slight decline in aggregate hours worked, although the longer trend remains strongly higher.
My bottom line is that the economy is once again showing strength - but this will once again trigger the Oil choke collar.
The unemployment rate fell by 0.4 percentage point to 8.6 percent in November, andnonfarm payroll employment rose by 120,000, the U.S. Bureau of Labor Statisticsreported today. Employment continued to trend up in retail trade, leisure andhospitality, professional and business services, and health care. Governmentemployment continued to trend down.So far, so good. Now let's look at the details:
In November, the unemployment rate declined by 0.4 percentage point to 8.6 percent.From April through October, the rate held in a narrow range from 9.0 to 9.2 percent.The number of unemployed persons, at 13.3 million, was down by 594,000 in November.The labor force, which is the sum of the unemployed and employed, was down by alittle more than half that amount.This takes a bit of an explanation. The unemployment rate is derived from the household survey, which gives us several important employment numbers. First, we get the civilian labor force, which comprises the denominator of the unemployment fraction (The civilian labor force is the total number of employed and unemployed people in the country). This amount decreased by 315,000. In addition, the number of employed in the household survey increased by 278,000 while the number of unemployed decreased by 594,000. Finally, the "not in the labor force" number increased by 487,000 (also remember that this number is horribly misunderstood and misrepresented. The increase could have just as easily been caused by an increase in the number of people retiring as from people giving up looking).
So putting this all together, we get the following:
More people are working (+278,000)
Fewer people are unemployed (-594,000) -- this number was a little more than twice the number of people employed.
The denominator of the equation decreased.
Overall, not bad. Some of the decrease was actually do to people not being unemployed.
Expect more discussion about the labor force participation rate from this report -- which decreased to 64%. I've discussed this before, but it bears repeating; we're now in an age when baby boomers are retiring -- meaning this number will probably be lower for the foreseeable future (in fact, I would argue the shape of the labor force has fundamentally changed because of this).
Let's move onto the establishment data:
Employment in retail trade rose by 50,000 in November, with much of the increaseoccurring in clothing and clothing accessories stores (+27,000) and in electronicsand appliance stores (+5,000). Since reaching an employment trough in December 2009,retailers have added an average of 14,000 jobs per month.
Employment in leisure and hospitality continued to trend up in November (+22,000).Within the industry, food services and drinking places added 33,000 jobs. This gainmore than offset a loss of 12,000 jobs in the accommodation industry. In the last12 months, leisure and hospitality added 253,000 jobs, largely driven by employmentincreases in food services and drinking places.
Employment in professional and business services continued to trend up in November(+33,000). Modest job gains continued in temporary help services.Health care employment continued to rise in November (+17,000). Within the industry,hospitals added 9,000 jobs. Over the past 12 months, health care has added an averageof 27,000 jobs per month.
Manufacturing employment changed little over the month and has remained essentiallyunchanged since July. In November, fabricated metal products added 8,000 jobs, whileelectronic instruments lost 2,000 jobs.
Construction employment showed little movement in November. Employment in theindustry has shown little change, on net, since early 2010.We see an overall improvement across the board in the establishment survey, with the exception of government employment.
Government employment continued to trend down in November, with a decline in the U.S.Postal Service (-5,000). Employment in both state government and local government hasbeen trending down since the second half of 2008.
On a scale of 1-10, I'd give this a 5.5.
-------------
NDD here with a few additional comments:
The best news is the continuing upward revisions of past reports. September and October were revised up a total of 72,000. For the last three months, the average gain was 143,000.
The more volatile household survey employment measure showed a gain of 278,000 in November on top of a gain of 277,000 in October. Since the household survey tends to lead at inflection points, these are very good numbers.
While the decline in the labor force will be trumpeted by bearish sites, this is responsible for only half of the .4 decline in the unemployment rate.
There were negatives, though. (1) Average hourly earnings actually decreased $.02. This is another reinforcing shot of real wage deflation. (2) The manufacturing workweek declined 2/10's of an hour. This is one of the 10 LEI, and is a significant negative although it just took back last month's gain. Over a longer period, this series is now trending sideways. (3) Only 2000 manufacturing jobs were added. This leading series is also trending sideways. (4) There was a slight decline in aggregate hours worked, although the longer trend remains strongly higher.
My bottom line is that the economy is once again showing strength - but this will once again trigger the Oil choke collar.
Morning Market
Looking at a chart of the SPYs, we see that prices have formed a symmetrical triangle. However, while we see a technical compliance with this pattern, it's a moderately weak formation. Notice that for a period of about two weeks, prices clung to the upper trend line. Ideally, in a triangle formation, we'd like to see clean hits followed by a more away from the trend line. And while we do see strong volume on the break-out move, the fundamental back-drop is less than encouraging. I personally don't think there is any positive reason for the recent coordinated bank liquidity move. In addition, the EU situation continues to hang on the precipice. In short, I wouldn't be trading this as an upside break out just yet. Prices would need to move through the 129 price level before I'd commit to the rally.
After breaking a strong upward trend, oil prices are now consolidating between the 96 and roughly 102.5 price level. However, the overall trend is still strong -- all the EMAs are moving higher, prices are above the EMAs and the MACD is about to give a buy signal. Fundamentally, we're not in the summer driving season and there is continued talk of an economic slowdown (some economists are now stating Europe is already in a recession). That being the case, it's hard to see a strong rally emerging should prices move through the 102 area.
The longer (IEF) and long (TLT) end of the Treasury curve also appear to be consolidating.
Thursday, December 1, 2011
Eurodoom
Yesterday, Matt Yglesias wrote a great column, that I believe explains part of the reason for the coordinated central bank action. Read the whole thing, but here is the meat of his argument:
But a different kind of analysis suggests that the United States could face catastrophe if the Eurozone tanks.
This terrifying possibility is suggested in a Nov. 7 lecture by Princeton professor Hyun Song Shi, “Global Banking Glut and Loan Risk Premium” (PDF). The starting point for his analysis is the fact—well-known to financial practitioners, unknown to the public, and perennially rediscovered by the economics profession—that a very large share of the world’s dollars are held in non-American accounts. Indeed, for several years in the late aughts the total dollar assets of non-American banks actually exceeded the total assets of the U.S. commercial banking system and even today the ratio is close to 1:1.
These foreign dollars—mostly held by European-headquartered global conglomerates—are not isolated from the American economy. Just as U.S. firms and households deposit money in American banks and take loans from the banks, European global banks intermediate between savers and spenders of dollars. A 2010 Bank of International Settlements survey (PDF) revealed that as of 2009, 161 foreign banks were operating 226 branches in the United States that raised more than $1 trillion in wholesale funding, largely through money markets. Dollars raised in the United States tend to ultimately work their way back to the United States (which, after all, is where you can use dollars to buy things) through the shadow banking system. European banks aren’t the only ones in this game, but they are the largest player. The upshot is that decisions made in Europe about how much leverage to take on play almost as big a role in determining American credit conditions as do decisions made in the United States.
The lecture goes on to argue that European decision-making played a large role in inflating the now departed credit bubble of the mid-aughts, an interesting technical issue that needn’t keep you up late at night. The implication, however, is that a massive and sudden contraction of the European banking system would have the effect of automatically contracting credit conditions in the United States. If European credit markets tightened, the dollars held by European banks would suddenly become much less available as the basis for lending to American financial intermediaries and, ultimately, firms and households.
It sounds counterintuitive to believe that less lending and less debt could be a problem when we’re currently suffering from the excessive borrowing of the past. But this hangover theory is mistaken. Less credit and less borrowing now will only make our problems worse. Some currently solvent enterprises and households will be pushed into bankruptcy by difficultly rolling over their current debt. Others will curtail purchases and investments. Both factors will reduce incomes and drive overall spending down, further adding to America’s already large stock of idle facilities and unemployed workers. The punch will come, in other words, not because the collapse of the European banking system will cripple the European economy and thus indirectly hurt our ability to sell things to Europeans. Instead the collapse of the European banking system will directly cripple an American economy that depends on European banks to provide a fair share of our credit. The middling growth of the past year has been powerfully driven by an incredible boom in equipment and software investment by American firms that could dry up overnight and deal a devastating blow to an already fragile economy.
Unleash the Floodgates of Money!!!!!!!
From Bloomberg:
Six central banks led by the Federal Reserve made it cheaper for banks to borrow dollars in emergencies in a global effort to ease Europe’s sovereign-debt crisis.Why did this happen?
Stocks rallied worldwide, commodities surged and yields on most European debt fell on the show of force from central banks aimed at easing strains in financial markets. The cost for European banks to borrow dollars dropped from the highest in three years, tempering concerns about the euro’s worsening crisis after leaders said they’d failed to boost the region’s bailout fund as much as planned.
“It’s supportive but not necessarily a game changer,” said Michelle Girard, senior U.S. economist at RBS Securities Inc. in Stamford, Connecticut. “The impact is more psychological than anything else” as investors take heart from policy makers’ coordination, Girard said.
The premium banks pay to borrow dollars overnight from central banks will fall by half a percentage point to 50 basis points, the Fed said today in a statement in Washington. The so- called dollar swap lines will be extended by six months to Feb. 1, 2013. The Fed coordinated the move with the European Central Bank and the central banks of Canada, Switzerland, Japan and the U.K.
On Tuesday evening, Standard & Poor's downgraded the long-term debt ratings of some of the largest banks in the world.There was a rumor that a European bank had nearly failed -- which is said to be untrue.
By Wednesday morning, the Federal Reserve, the European Central Bank and central banks from
Canada, England, Japan and Switzerland announced coordinated action to support liquidity in financial markets that mirrors the 2008 financial crisis.
Mere coincidence? Likely not.
Once banks saw their ratings downgraded, it raised the specter that they would have to post billions in additional collateral on trades just as market pressures make it hard for them to replace the funds through a stock or bond offering.
The Interwebs are all aflame with a rumor that a European bank was about to go kaput last night, which is what inspired central banks to turn up the liquidity spigots today.Regardless of the rumor mill, the impetus for this coordinated move -- whatever it was -- can't be good; central banks don't increase liquidity in a massive move unless there is something wrong somewhere. Period.
Trouble is, there’s not an ounce of evidence this is true.
The rumor is based on a blog post written at Forbes by a nuclear physicist/hedge-fund manager that is pure speculation on his part: The only reason central banks would do this, he says, is if a bank was on the verge of failure.
Wednesday, November 30, 2011
Morning Market
Yesterday, the big news was the release of massive liquidity in a coordinated move by the central banks. While I don't believe this was a positive development (more on that in the next post) the markets were obviously thrilled. Prices moved through all three EMAs on decent volume. Yesterday's fundamental event was what was required in order for the market to get out of its downward move (again, assuming the reason for the liquidity was solid).
The 5-mnute chart shows a massive gap higher, a sideways consolidation and then another move higher at the end of trading.
In contrast, we see money moving out of the treasure market, with prices gapping lower and then moving sideways.
Despite the challenging fiscal environment, the municipal bond index is still in good shape. Prices are near yearly highs. The EMAs are all moving higher and the shorter EMAs are above the longer. However, notice the arc of average is moving more and more sideways, indicating the upward momentum may be stalling.
Bonddad Linkfest
- India GDP slows to 6.9%
- Eurozone unemployment hits Euro area high
- Danish economy shrinks again
- Businesses are planning for an end to the euro
- Do financials even matter to the stock market anymore?
- Three inconvenient truths for OWS
- Eurodoom
- New home sales stuck at low levels
- US home sales and prices
- 10 brands that will disappear in 2012
Consumer Confidence and Personal Consumption Expenditures
With yesterday's much publicized jump in consumer sentiment, I thought I'd take a look at the relationship between consumer spending and consumer sentiment.
The above chart shows the percentage change from last year of personal consumption expenditures (left side scale) and the University of Michigan's consumer sentiment (right side scale). Notice there is a pretty strong relationship -- except for this recovery.
The "Going Nowhere" Economy
For the last year, the economy has been stuck in the mud. We're growing, but not at a fast enough pace to lower unemployment. Consider the following charts:
The Annualized GDP rate has been at or below 2.5% for the last 5 quarters. Three quarters ago we were barely growing. And while the last two quarters have seen some increases in the rate of growth, we're still below 2.5% -- in other words, barely growing. As a result:
The unemployment rate -- while it's dropped a bit -- is still at very high levels. Put another way
The unemployment rate has been stuck between 9.4% and 9.8% for the last 9 months. And based on the 4-week moving average of initial unemployment clams:
We're not going to see a change anytime soon.
In other words, we're growing, but not enough to lower unemployment.
The Annualized GDP rate has been at or below 2.5% for the last 5 quarters. Three quarters ago we were barely growing. And while the last two quarters have seen some increases in the rate of growth, we're still below 2.5% -- in other words, barely growing. As a result:
The unemployment rate -- while it's dropped a bit -- is still at very high levels. Put another way
The unemployment rate has been stuck between 9.4% and 9.8% for the last 9 months. And based on the 4-week moving average of initial unemployment clams:
We're not going to see a change anytime soon.
In other words, we're growing, but not enough to lower unemployment.
Tuesday, November 29, 2011
Morning Market
Even though the SPYs have risen the last two days, notice that prices moved lower throughout the respective trading day. In short, this is not a strong rally.
The daily chart shows the latest action in more detail. Notice the very small candles that have printed over the last two days. In addition, prices have closed below the 10 day EMA -- which is the lowest EMA.
In addition, the IWMs are more or less trading sideways instead of rising. If the market were increasing its respective risk appetite, this index would be moving higher strongly.
The above charts tell us that the equity market rally is extremely weak and, barring a profound fundamental event, will probably peter out, sending the markets lower. Should this happen, our first price targets will be previously established lows.
Both the IEFs and the TLTs are consolidating after a sell-off. This could also be seen as standard profit-taking after a small rally.
Finally, it appears the dollar is beginning a long consolidation process by forming a symmetrical triangle trading pattern.
Bonddad Linkfest
- Italy pays record yields at auction
- Democrats seek to extend payroll tax cut
- Gingrich's economic plan
- Sweden grows at 4.6% clip
- State budgets slowly improving
- Household debt overhang continues to move lower
- OECD warns of possible US recession
- New home sales tick up
- Consumer confidence picks up
- US home prices decline
How to Solve the Economic Problem; and Why We're Not
A welcome to readers of Economists View -- and a thanks to Professor Thoma for the link.
The economic situation really hasn't changed much in the last 12 months. The US economy is still barely growing, meaning the high unemployment rate won't get much higher, but also won't get much lower. The EU is still in the middle of a dire financial situation which is helping to keep a lid on economic growth, while China is still working at lowering inflation (although they are close to the end of the endeavor).
So -- how do we actually end this situation? From Bill Keller of the NY Times:
Yes, there is a simple way to solve the problem. And while I've been over it many times, let's revisit it again.
1.) Borrow money. Despite the incredibly stupid complaints of people about federal spending, the bond market isn't worried about the US' fiscal situation right now. The 10-year bond is trading right around 2%.
2.) Rebuild the nation's infrastructure: According to the society of civil engineers, the US' infrastructure gets a grade of D-. I recently noted a story from AgWeb that also illustrates the problem.
3.) Hire people to do the work. Considering that half the un\employed are blue collar workers (people that do things like ... construction) this would lower unemployment -- which also happens to be a big problem right now.
4.) This increases aggregate demand, which increases GDP. Once you get GDP growing at 3%+ for a few quarters, the economy because self-sustaining. This also helps to halt the debt/GDP growth rate.
SOOOOOOOO why don't we do this?
Republicans now have the luxury of living in a fact-free world thanks to Fox news and talk radio. Ever wonder why a mere 6% of scientists consider themselves Republicans? Because Republicans are now completely fact-free in a majority of their statements and policy proposals. Here is but one example: sometime over the last year, Paul Ryan proposed a new budget plan with economic analysis provided by the Heritage Foundation. The plan started to unravel after Paul Krugman noticed the plan projected unemployment at 2.3% at the end of the decade. After that, a group of people (of which I was one) shredded the plan -- as in demonstrated that it was put together by a third-grader with a crayon. It got so bad that Heritage eventually took it down only to erase the more egregious assumptions. That's just one example of how fact free the Republican party has become.
The point to the above two paragraphs is simple: our political system is beyond broken and dysfunctional. I'm not quite sure where that is, but I do know it's a really bad place to be. And that is why watching the train-wreck that is the daily news is so frustrating: solving the problem is easy, but our political system has become so dysfunctional as to prevent that from happening.
The economic situation really hasn't changed much in the last 12 months. The US economy is still barely growing, meaning the high unemployment rate won't get much higher, but also won't get much lower. The EU is still in the middle of a dire financial situation which is helping to keep a lid on economic growth, while China is still working at lowering inflation (although they are close to the end of the endeavor).
So -- how do we actually end this situation? From Bill Keller of the NY Times:
But while there are things a columnist can ignore (if Kim Kardashian ever features in this column, just shoot me), our failing economic ecosystem is not one of them. So for the past several weeks my airplane and bedside reading has consisted of sexy documents like “A Roadmap for America’s Future” and “The Way Forward” and “The Moment of Truth” and “Restoring America’s Future” and “Living Within Our Means and Investing in the Future.” I’ve also reached out to a few economists respected for the integrity of their science and their patience with economic illiterates.
The first thing I gleaned from this little tutorial will probably not surprise you: There really is a textbook way to fix our current mess. Short-term stimulus works to help an economy recover from a recession. Some kinds of stimulus pay off more quickly than others. Once the economic heart is pumping again, we need to get our deficits under control. The way to do that is a balance of spending cuts, increased tax revenues and entitlement reforms. There is room to argue about the proportions and the timing, and small differences can produce large consequences, but the basic formula is not only common sense, it is mainstream economic science, tested many times in the real world.
Yes, there is a simple way to solve the problem. And while I've been over it many times, let's revisit it again.
1.) Borrow money. Despite the incredibly stupid complaints of people about federal spending, the bond market isn't worried about the US' fiscal situation right now. The 10-year bond is trading right around 2%.
2.) Rebuild the nation's infrastructure: According to the society of civil engineers, the US' infrastructure gets a grade of D-. I recently noted a story from AgWeb that also illustrates the problem.
3.) Hire people to do the work. Considering that half the un\employed are blue collar workers (people that do things like ... construction) this would lower unemployment -- which also happens to be a big problem right now.
4.) This increases aggregate demand, which increases GDP. Once you get GDP growing at 3%+ for a few quarters, the economy because self-sustaining. This also helps to halt the debt/GDP growth rate.
SOOOOOOOO why don't we do this?
So what’s the problem? Why is our system so fundamentally stuck? Partly it’s a colossal, bipartisan lack of the political courage required to tell people what they sort of know but don’t want to hear. Partly it’s a Republican Party that, for its own cynical reasons, wants no deal with this president. Partly it’s moneyed, focused lobbies that swarm in defense of specific advantages written into the law; there is no comparable lobby for compromise, let alone sacrifice.Let me address the political problem, because I think it's the really big elephant in the room. The Democrats can't lead. Period. The president sends a proposal to the Republicans and then offers the "pre-compromised" version before negotiations get out of the gate. He has yet to figure out that he is hated -- as in really hated -- because of what he symbolizes: the end of the WASP power structure as we know it. And Congressional Democrats have no backbone. Case in point: perennial pain in the ass Joe Lieberman should have been given an office by the janitor (with an apology to the janitor) along with every meaningless committee assignment possible. Instead, he's a media darling.
Republicans now have the luxury of living in a fact-free world thanks to Fox news and talk radio. Ever wonder why a mere 6% of scientists consider themselves Republicans? Because Republicans are now completely fact-free in a majority of their statements and policy proposals. Here is but one example: sometime over the last year, Paul Ryan proposed a new budget plan with economic analysis provided by the Heritage Foundation. The plan started to unravel after Paul Krugman noticed the plan projected unemployment at 2.3% at the end of the decade. After that, a group of people (of which I was one) shredded the plan -- as in demonstrated that it was put together by a third-grader with a crayon. It got so bad that Heritage eventually took it down only to erase the more egregious assumptions. That's just one example of how fact free the Republican party has become.
The point to the above two paragraphs is simple: our political system is beyond broken and dysfunctional. I'm not quite sure where that is, but I do know it's a really bad place to be. And that is why watching the train-wreck that is the daily news is so frustrating: solving the problem is easy, but our political system has become so dysfunctional as to prevent that from happening.
Monday, November 28, 2011
Morning Market
All the major equity indexes are caught between the 38.2% and 61.8% Fibonacci level of their respective charts. However, all the shorter EMAs are now moving lower with the shorter below the longer. My best guess is we're looking at a sideways consolidation until we get a firm read from the EU.
Copper is still very bearish. Prices are in a downward sloping channel. The shorter EMAs are all moving lower, with the shorter below the longer. Prices are also below the 200 day EMA. Nothing in this chart looks promising. A convincing move higher would require a move through all the EMAs, preferably on decent volume.
The high-grade corporate market has broken important trend lines.
A Few Chart Notes
Gold is in the middle of a multi-month, symmetrical triangle consolidation.
Financial comprise about 13% of the SPYs. Notice the financial sector is in very bad technical shape. They are in a clear downward trend. While they tried to rally at the end of October, the hit resistance at the 200 day EMA.
Real wage deflation, savings rate decline raise yellow flags
- by New Deal democrat
Permabulls and permabears constantly change the data they highlight in order to justify their already-held conclusion. One way I try to keep myself honest is to look at the same data-sets over and over again - something I do every week in my "Weekly Indicators" posts. With the temporary lull in dramatic (US) economic direction, I am updating a number of metrics I haven't looked at in awhile. Last week, I looked at leading indicators for jobs.
In this post, I am updating two related series that in the past have been leading data for GDP: real wages and personal savings. It's a good thing I didn't wait much longer, because in the last few months, both have taken a turn for the worse.
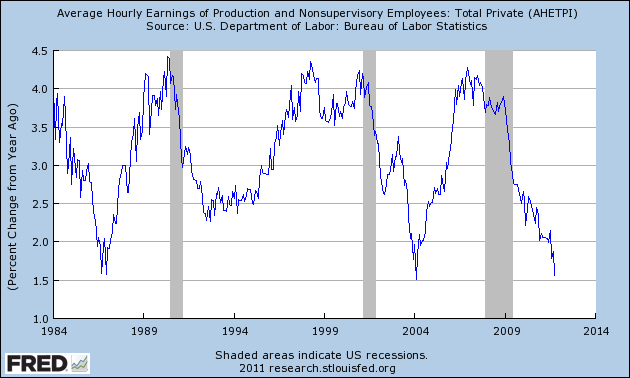
Prof. Paul Krugman has been alarmed by the decline in wage growth for some time. In the last few months the situation has worsened. This is average earnings for nonsupervisory workers, which is part of the monthly employment report:
Note that while YoY% wage increases have rapidly declined from 2% to 1.5% in the last few months (note: median wages would be a more accurate measure, but they are only updated quarterly), this graph does not suggest alarm -- in the past YoY% wage increases have made a trough if anything in the middle of economic expansions.
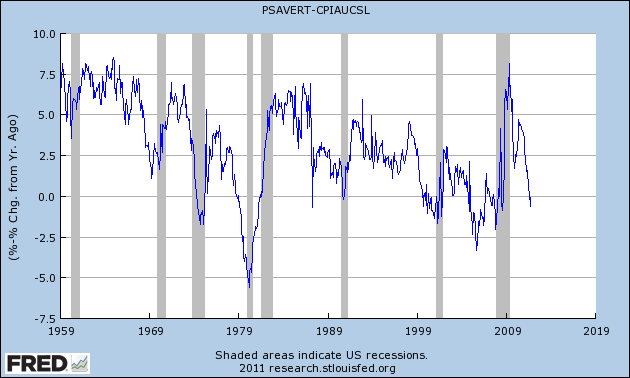
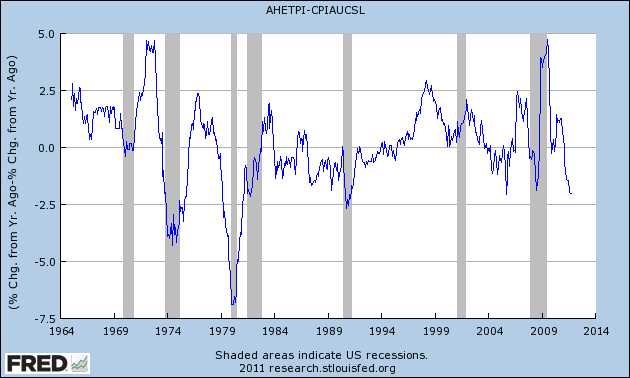
This next graph, however, adjusts wage growth for inflation, to give us "real average hourly wages" and this tells a different story:

Every recession in the last 50 years has been preceded by or coincided with a significant decline in real wage growth. The more significant the decline, the more likely it presages a recession. Further, with the exception of 1987 and the peak of the housing bubble, every time YoY wage growth has turned as negative as it is now, a recession has followed.
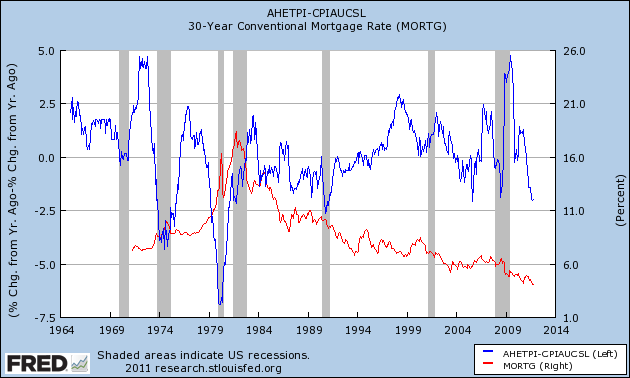
One reason that negative YoY real wages haven't always led to a recession is their interaction with interest rates, in particular mortgage rates, as shown in this next graph, which overlays 30 year conventional mortgage rates in red:

Real wages actually declined throughout the 1980's, but interest rates consistently declined - from 20% to 10%! - until 1987, allowing mortgages to be refinanced at lower and lower rates. It was only after interest rates failed to decline further for a period of 3 years that a recession was triggered in 1990. Similarly the interest rate declines of the early 2000's helped fuel the housing bubble despite real wage declines in the middle of the decade.
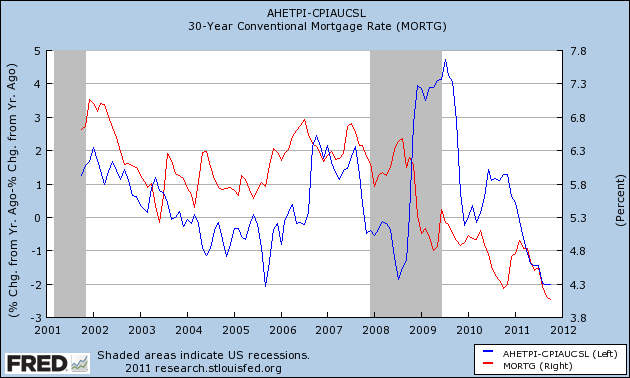
Here is a close-up of the same information for the last 10 years:

Interest rates have declined further since the onset of the "great recession", from 6% to under 4%, allowing more refinancing. Whether this is enough to offset the decline in real wages is questionable, and certainly cannot go on for more than several years.
Now let's turn to personal savings and the savings rate.
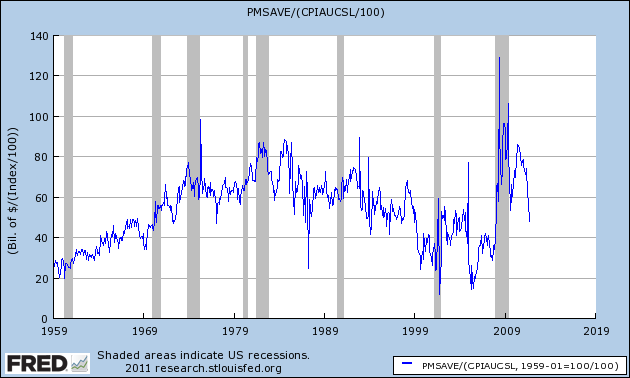
Personal savings are the "fuel" that supplies the consumption that is 2/3's of the US economy. The best way to look at this data is to norm for inflation, to give us "real personal savings" which is shown in this graph:

One reason we have not had any "double dip" is because of the enormous amount of fuel that was stockpiled during and immediately after the "great recession." In the last year, however, much of this fuel has been spent, primarily on higher energy costs.
In the past, I found that the "real personal savings" rate - that is, the savings rate as compared with the inflation rate - was a noisy but important long leading indicator for GDP. This next graph shows the "real personal savings rate" by itself:

With the same exceptions of 1987 and the housing bubble, a steep decline in the real personal savings rate has always presaged the outset of recessions.
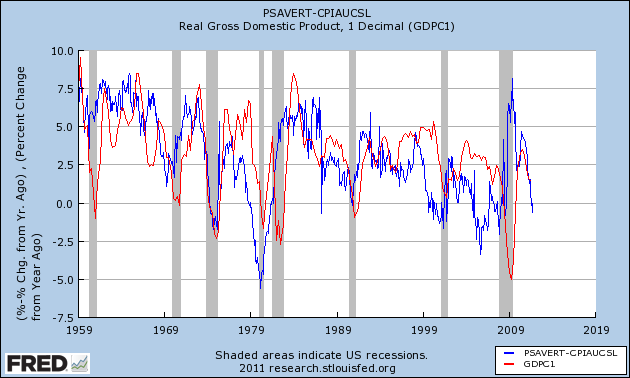
Now let's overlay real GDP data, in red:

While the relationship is noisy, you can see that the real personal savings rate generally leads real GDP by a period of 6 to 18 months. That real personal savings are now negative is an important recession warning in that time frame.
Permabulls and permabears constantly change the data they highlight in order to justify their already-held conclusion. One way I try to keep myself honest is to look at the same data-sets over and over again - something I do every week in my "Weekly Indicators" posts. With the temporary lull in dramatic (US) economic direction, I am updating a number of metrics I haven't looked at in awhile. Last week, I looked at leading indicators for jobs.
In this post, I am updating two related series that in the past have been leading data for GDP: real wages and personal savings. It's a good thing I didn't wait much longer, because in the last few months, both have taken a turn for the worse.
Prof. Paul Krugman has been alarmed by the decline in wage growth for some time. In the last few months the situation has worsened. This is average earnings for nonsupervisory workers, which is part of the monthly employment report:

Note that while YoY% wage increases have rapidly declined from 2% to 1.5% in the last few months (note: median wages would be a more accurate measure, but they are only updated quarterly), this graph does not suggest alarm -- in the past YoY% wage increases have made a trough if anything in the middle of economic expansions.
This next graph, however, adjusts wage growth for inflation, to give us "real average hourly wages" and this tells a different story:

Every recession in the last 50 years has been preceded by or coincided with a significant decline in real wage growth. The more significant the decline, the more likely it presages a recession. Further, with the exception of 1987 and the peak of the housing bubble, every time YoY wage growth has turned as negative as it is now, a recession has followed.
One reason that negative YoY real wages haven't always led to a recession is their interaction with interest rates, in particular mortgage rates, as shown in this next graph, which overlays 30 year conventional mortgage rates in red:

Real wages actually declined throughout the 1980's, but interest rates consistently declined - from 20% to 10%! - until 1987, allowing mortgages to be refinanced at lower and lower rates. It was only after interest rates failed to decline further for a period of 3 years that a recession was triggered in 1990. Similarly the interest rate declines of the early 2000's helped fuel the housing bubble despite real wage declines in the middle of the decade.
Here is a close-up of the same information for the last 10 years:

Interest rates have declined further since the onset of the "great recession", from 6% to under 4%, allowing more refinancing. Whether this is enough to offset the decline in real wages is questionable, and certainly cannot go on for more than several years.
Now let's turn to personal savings and the savings rate.
Personal savings are the "fuel" that supplies the consumption that is 2/3's of the US economy. The best way to look at this data is to norm for inflation, to give us "real personal savings" which is shown in this graph:

One reason we have not had any "double dip" is because of the enormous amount of fuel that was stockpiled during and immediately after the "great recession." In the last year, however, much of this fuel has been spent, primarily on higher energy costs.
In the past, I found that the "real personal savings" rate - that is, the savings rate as compared with the inflation rate - was a noisy but important long leading indicator for GDP. This next graph shows the "real personal savings rate" by itself:

With the same exceptions of 1987 and the housing bubble, a steep decline in the real personal savings rate has always presaged the outset of recessions.
Now let's overlay real GDP data, in red:

While the relationship is noisy, you can see that the real personal savings rate generally leads real GDP by a period of 6 to 18 months. That real personal savings are now negative is an important recession warning in that time frame.
In general, the above two sets of data suggest to me that consumers, who had accumulated a lot of "fuel" in 2008 and 2009, have been spending it to make up for declining real wages. This is one reason that retail sales have consistently held up so well this year in the face of low wage increases and high gasoline prices. This stockpile, however, has now mainly been spent. Unless refinancing due to lower interest rates is sufficient to free up more disposable income (hence yellow flags rather than a red flag), there will likely be another consumer retrenchment, and thus another recession, at some point in the next 18 months.
Bonddad Linkfest
- OECD warns of contagion risk
- OECD warns of slower economic growth
- EU in talks to create closer ties
- Black Friday sales were strong and encouraging
- Europe's banks feeling a funding freeze
- China looking to invest in foreign infrastructure
- Black Friday sales hit record
- SPY looking negative in daily and weekly time frames
- EU spreads are pretty ugly
Sunday, November 27, 2011
Morning Market
When looking at the big picture, notice that SPY prices went slightly above previously established lows, fell back to the 200 day EMA, rose again, but couldn't maintain upward momentum and have since fallen back.
The IWMs have followed a similar long-term trajectory.
The 3 month charts shows the detail of the latest sell-off. Prices have dropped sharply for the last week, printing 7 red candles (along with several gaps). Prices are now near the 61.8% Fibonacci level. All the shorter EMAs are now moving lower and all are also below the 200 day EMA. If prices move through the Fib level, the next target is the low of the chart -- right below 108.
The long-end of the treasury curve has benefited from the equity sell off. Prices are in a clear uptrend and all the EMAs are moving higher. However, we haven't seen a strong volume surge. Additionally, the US is only a safe haven by default; in reality, our political system is heavily compromised and our economy is still fairly weak.
After breaking its uptrend and selling off to the 20 day EMA, prices rebounded strongly on Friday, printing a strong upward bar. However, right now the rally is still deflated; the MACD is already at high levels and has given a sell signal; prices are now below a strong trend line that will act as upward resistance and the shorter EMAs are already moving sideways. Right now the chart has a higher probability of consolidating sideways rather than moving sideways.
Saturday, November 26, 2011
Weekly indicators: hope for a good jobs report edition
- by New Deal democrat
In the rear view mirror, second quarter GDP was revised down from 2.5% to 2.0%. The more forward looking durable goods orders declined for a second month, down -0.7%. Another leading indicator, the University of Michigan final consumer sentiment reading for November showed that consumer confidence has rebounded about halfway from its debt ceiling debacle collapse that began in July. Personal income was up 0.4%, while spending rose only 0.1%. The personal savings rate rose .2% to 3.5%.
With the continuing exception of Oil prices, and a small increase in corporate bond yield spreads, all of the high frequency weekly indicators turned in another positive week.
Let's start again this week by looking at jobs. While there was some weekly noise, the trend remains positive. The BLS reported that Initial jobless claims rose 5,000 to 393,000. The four week average declined 2500 to 394,250. The four week average remains close to its best reading in over 3 years.
The American Staffing Association Index rose by 1 to 92 last week. In the last couple of months, this series has resumed a slight upward trajectory, but remains lower YoY.
Tax withholding returned to a positive YoY reading this week. Adjusting +1.07% due to the 2011 tax compromise, the Daily Treasury Statement showed that while for the first 16 reporting days of November, $109.7 B was collected vs. $112.1 a year ago, a decline of -2.4 B, for the last 20 days, $137.5 B was collected vs. $130.0 a year ago, an increase of $7.5 B or 5.7%. I use the 20 day metric precisely because there is a definite pattern to deposits by day of the week. Thus it appears that last week's negative YoY 4 week loss may have been an outlier. This will be closely watched in the next several weeks.
Housing continues to show stabilization. The Mortgage Bankers' Association reported that seasonally adjusted purchase mortgage applications increased 8.2% last week. On a YoY basis, purchase applications were up 4.8%. Although YoY reports have been negative for several months, the actual change is very slight, and we remain firmly within the range that purchase mortgage applications have been in since May 2010. Refinancing fell -4.0% w/w despite near record low rates, and may have been strongly influenced by seasonality.
YoY weekly median asking house prices from 54 metropolitan areas at Housing Tracker showed that the asking prices declined -0.3% YoY. Once again, this is a new "best" YoY reading in 5 1/2 years. The areas with YoY% increases in price increased to 21, meaning that 40% of all metropolitan areas in this survey now have YoY positive changes in asking prices. Only Chicago still showed double-digit YoY% declines. YoY asking prices for houses could turn positive on a nationwide basis as early as this week.
Retail same store sales remained positive as they have been all year. The ICSC reported that same store sales for the week of November 12 decreased -0.9% w/w but increased 2.8% YoY. Shoppertrak reported that YoY sales rose 3.8% YoY but were off -3.4% week over week. We have entered a period of high seasonality, so the YoY figures are by far the more reliable measure of sales.
The American Association of Railroads reported that total carloads increased 1.9% YoY, up about 10,400 carloads YoY to 545,100. Intermodal traffic (a proxy for imports and exports) was up 7,000 carloads, or 3.0% YoY. The remaining baseline plus cyclical traffic increased 3400 carloads or 1.1% YoY. Total rail traffic has improved substantially in the last two months after having turned negative for 6 of 12 weeks during the summer.
Weekly BAA commercial bond rates rose .04% to 5.16%. Contrarily, yields on 10 year treasury bonds fell .03% to 2.02%. This is the second week of very small increasing spreads in contrary directions. If it were to continue and amplify, it would represent significant weakness.
Finally, the Oil choke collar remains engaged, as Oil closed at $96.77 a barrel on Friday. This remains above the recession-trigger level calculated by analyst Steve Kopits. Gas at the pump decreased $.07 to $3.37 a gallon. Measured this way, we probably are about $.10 above the 2008 recession trigger level. Gasoline usage is once again off substantially, down -2.7% YoY, at 8592 M gallons vs. 8829 M a year ago. The 4 week moving average is off -3.9%. This continues to suggest that consumers have permanently altered their gasoline usage habits towards more conservation.
Money supply was not reported this week.
If ECRI's recession call is correct, it appears it will have to be imported from Europe and China via manufacturing, or else the consumer is going to have to finally give out due to real wage declines. There is simply no sign of recession in the recent weekly indicators. More specifically, the continuation of sub-400,000 initial jobless claims reports suggest that we will see a good jobs report this coming Friday.
In the rear view mirror, second quarter GDP was revised down from 2.5% to 2.0%. The more forward looking durable goods orders declined for a second month, down -0.7%. Another leading indicator, the University of Michigan final consumer sentiment reading for November showed that consumer confidence has rebounded about halfway from its debt ceiling debacle collapse that began in July. Personal income was up 0.4%, while spending rose only 0.1%. The personal savings rate rose .2% to 3.5%.
With the continuing exception of Oil prices, and a small increase in corporate bond yield spreads, all of the high frequency weekly indicators turned in another positive week.
Let's start again this week by looking at jobs. While there was some weekly noise, the trend remains positive. The BLS reported that Initial jobless claims rose 5,000 to 393,000. The four week average declined 2500 to 394,250. The four week average remains close to its best reading in over 3 years.
The American Staffing Association Index rose by 1 to 92 last week. In the last couple of months, this series has resumed a slight upward trajectory, but remains lower YoY.
Tax withholding returned to a positive YoY reading this week. Adjusting +1.07% due to the 2011 tax compromise, the Daily Treasury Statement showed that while for the first 16 reporting days of November, $109.7 B was collected vs. $112.1 a year ago, a decline of -2.4 B, for the last 20 days, $137.5 B was collected vs. $130.0 a year ago, an increase of $7.5 B or 5.7%. I use the 20 day metric precisely because there is a definite pattern to deposits by day of the week. Thus it appears that last week's negative YoY 4 week loss may have been an outlier. This will be closely watched in the next several weeks.
Housing continues to show stabilization. The Mortgage Bankers' Association reported that seasonally adjusted purchase mortgage applications increased 8.2% last week. On a YoY basis, purchase applications were up 4.8%. Although YoY reports have been negative for several months, the actual change is very slight, and we remain firmly within the range that purchase mortgage applications have been in since May 2010. Refinancing fell -4.0% w/w despite near record low rates, and may have been strongly influenced by seasonality.
YoY weekly median asking house prices from 54 metropolitan areas at Housing Tracker showed that the asking prices declined -0.3% YoY. Once again, this is a new "best" YoY reading in 5 1/2 years. The areas with YoY% increases in price increased to 21, meaning that 40% of all metropolitan areas in this survey now have YoY positive changes in asking prices. Only Chicago still showed double-digit YoY% declines. YoY asking prices for houses could turn positive on a nationwide basis as early as this week.
Retail same store sales remained positive as they have been all year. The ICSC reported that same store sales for the week of November 12 decreased -0.9% w/w but increased 2.8% YoY. Shoppertrak reported that YoY sales rose 3.8% YoY but were off -3.4% week over week. We have entered a period of high seasonality, so the YoY figures are by far the more reliable measure of sales.
The American Association of Railroads reported that total carloads increased 1.9% YoY, up about 10,400 carloads YoY to 545,100. Intermodal traffic (a proxy for imports and exports) was up 7,000 carloads, or 3.0% YoY. The remaining baseline plus cyclical traffic increased 3400 carloads or 1.1% YoY. Total rail traffic has improved substantially in the last two months after having turned negative for 6 of 12 weeks during the summer.
Weekly BAA commercial bond rates rose .04% to 5.16%. Contrarily, yields on 10 year treasury bonds fell .03% to 2.02%. This is the second week of very small increasing spreads in contrary directions. If it were to continue and amplify, it would represent significant weakness.
Finally, the Oil choke collar remains engaged, as Oil closed at $96.77 a barrel on Friday. This remains above the recession-trigger level calculated by analyst Steve Kopits. Gas at the pump decreased $.07 to $3.37 a gallon. Measured this way, we probably are about $.10 above the 2008 recession trigger level. Gasoline usage is once again off substantially, down -2.7% YoY, at 8592 M gallons vs. 8829 M a year ago. The 4 week moving average is off -3.9%. This continues to suggest that consumers have permanently altered their gasoline usage habits towards more conservation.
Money supply was not reported this week.
If ECRI's recession call is correct, it appears it will have to be imported from Europe and China via manufacturing, or else the consumer is going to have to finally give out due to real wage declines. There is simply no sign of recession in the recent weekly indicators. More specifically, the continuation of sub-400,000 initial jobless claims reports suggest that we will see a good jobs report this coming Friday.
Thursday, November 24, 2011
Why I'm giving thanks to the Occupy Wall Street movement
- by New Deal democrat
This Thanksgiving something like 99% of Americans owe a special thanks to the Occupy Wall Street movement. It is not a question of what the movement does next, or what agenda or specifics it needs to succeed. It already has succeeded, and the only question is whether its success will continue.
Let's flash back nearly 5 months. The House Republican caucus refused to pass what until then had been a pro forma raising of the US's debt ceiling, taking the payment of our country's debts hostage to partisan demands about cuts in social spending. Over the Fourth of July weekend, President Barack Obama proposed a "grand bargain", for the first time explicitly proposing cuts to Medicare and Social Security as an enticement to obtain tax increase concessions from the GOP. The GOP still refused, even though the proposed "bargain" was weighted something like 10 to 1 in favor of spending cuts over tax increases. At the end of the day, only 174 House Republicans mustered the political courage to vote in favor of paying this country's bills. Nancy Pelosi and the Democrats had to come to their rescue on August 2. In direct reaction to that debacle, Standard and Poor's downgraded the US's credit rating from AAA two days later.
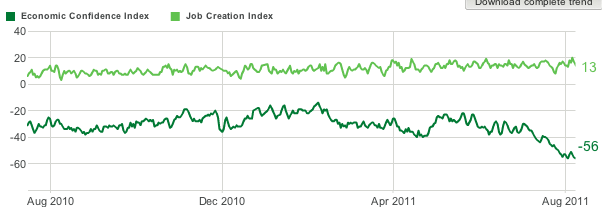
During that 5 week period, according to the daily Gallup poll, the economic confidence of Americans plummeted - to ratings not seen since the worst of the "great recession."

Economic indicators began to show outright contraction by mid-August. More and more it looked like a recession might be about to start.
In direct response to the debt ceiling debacle, in which the wishes of the majority of Americans -- for the budget to be balanced primarily via tax increases on the rich, and secondarily by cuts in military and general domestic spending, with Social Security and Medicare left intact -- were ignored and spurned by Washington, on July 13 a Canadian magazine called for an occupation of Wall Street to start on September 17. As the US News and World Report put it, on July 26:
That relentless focus by the OWS movement has shone the bright light of day on the efforts of the elite in Washington to enshrine the Bush tax cuts for the wealthy while spending cuts are proposed for everybody else.
Without the Occupy Wall Street movement, I doubt very much Washington would have been derailed from its toxic austerian plans. So this Thanksgiving Day I say "Thank you, OWS."
This Thanksgiving something like 99% of Americans owe a special thanks to the Occupy Wall Street movement. It is not a question of what the movement does next, or what agenda or specifics it needs to succeed. It already has succeeded, and the only question is whether its success will continue.
Let's flash back nearly 5 months. The House Republican caucus refused to pass what until then had been a pro forma raising of the US's debt ceiling, taking the payment of our country's debts hostage to partisan demands about cuts in social spending. Over the Fourth of July weekend, President Barack Obama proposed a "grand bargain", for the first time explicitly proposing cuts to Medicare and Social Security as an enticement to obtain tax increase concessions from the GOP. The GOP still refused, even though the proposed "bargain" was weighted something like 10 to 1 in favor of spending cuts over tax increases. At the end of the day, only 174 House Republicans mustered the political courage to vote in favor of paying this country's bills. Nancy Pelosi and the Democrats had to come to their rescue on August 2. In direct reaction to that debacle, Standard and Poor's downgraded the US's credit rating from AAA two days later.
During that 5 week period, according to the daily Gallup poll, the economic confidence of Americans plummeted - to ratings not seen since the worst of the "great recession."

Economic indicators began to show outright contraction by mid-August. More and more it looked like a recession might be about to start.
In direct response to the debt ceiling debacle, in which the wishes of the majority of Americans -- for the budget to be balanced primarily via tax increases on the rich, and secondarily by cuts in military and general domestic spending, with Social Security and Medicare left intact -- were ignored and spurned by Washington, on July 13 a Canadian magazine called for an occupation of Wall Street to start on September 17. As the US News and World Report put it, on July 26:
A group calling itself "New Yorkers Against Budget Cuts" announce[d] a meeting on Wall Street on August 2 to protest potential austerity measures as a result of the debt-ceiling crisis. That day, another set of protesters planning for an upcoming "occupation" protest joins them, and, according to occupywallst.org, after the assembly the two groups "gather into working groups to plan for the September 17 occupation of Wall Street."As Dean Baker described so well yesterday, the OWS movement has successfully forced the mainstream media and Washington to acknowledge that by far the biggest problem facing this country is not deficit reduction at all, but rather the now-chronic lack of jobs in the economy, and the longstanding and ongoing and increasingly disparate distribution of income in the US, due to economic and tax policies that favor an upward redistribution of wealth to a very few at the top, who are "too big to fail", vs. "the 99%" for whom there are no bailouts but only calls for austerity and sacrifice.
That relentless focus by the OWS movement has shone the bright light of day on the efforts of the elite in Washington to enshrine the Bush tax cuts for the wealthy while spending cuts are proposed for everybody else.
As a result, OSW is directly responsible for two outcomes in Washington in the last two weeks. One is the failure of the 'Supercommittee' in which Democrats refused to capitulate to GOP demands of no meaningful tax increases, and unlike July refused to dangle ever larger Social Security and Medicare cuts as an enticement. As a result, on January 1, 2013 the Bush income and estate tax cuts are set to expire, and cuts in military and general domestic spending will make up the difference.
Secondly, GOP hostage-taking came to an abrupt and very quiet halt. The latest stopgap budget resolution was set to expire on Saturday November 19. In stark difference to their behavior earlier this year, the House Republican caucus quietly passed another stopgap resolution to avoid a government shutdown through December 16.
Meanwhile economic confidence has regained at least part of its lost ground, and recent data shows that Americans are increasing their spending on purchases like cars. The threat of at least an imminent domestic recession appears to be receding.
Secondly, GOP hostage-taking came to an abrupt and very quiet halt. The latest stopgap budget resolution was set to expire on Saturday November 19. In stark difference to their behavior earlier this year, the House Republican caucus quietly passed another stopgap resolution to avoid a government shutdown through December 16.
Meanwhile economic confidence has regained at least part of its lost ground, and recent data shows that Americans are increasing their spending on purchases like cars. The threat of at least an imminent domestic recession appears to be receding.
Without the Occupy Wall Street movement, I doubt very much Washington would have been derailed from its toxic austerian plans. So this Thanksgiving Day I say "Thank you, OWS."
Tuesday, November 22, 2011
Happy Thanksgiving
My father is in for the holidays, so I think this is a good time to sign off for the already holiday shortened week. We'll be back next Monday.
Until then, have a safe and happy Thanksgiving. And just in case you need a little off-center humor for the week ...
I couldn't resist this one.
Until then, have a safe and happy Thanksgiving. And just in case you need a little off-center humor for the week ...
I couldn't resist this one.
About The "Oursourcing Our Jobs" Argument
From the WSJ:
This is a a point that needs to be stressed when we're talking about the "outsourced" jobs. In reality, there are many regions of the world that are growing at far more impressive rates than the US. In addition, these are new markets with an emerging middle class. That means is simply makes more sense to locate the factories and manufacturing facilities in these countries to sell to that market.
U.S.-based multinational corporations added 1.5 million workers to their payrolls in Asia and the Pacific region during the 2000s, and 477,500 workers in Latin America, while cutting payrolls at home by 864,000, the Commerce Department reported.
The faster growth abroad was concentrated in emerging markets, such as China, Brazil, India and Eastern Europe, according to economists Kevin Barefoot and Raymond Mataloni, of the U.S. Commerce Department.
"Judging by the destination of sales by affiliates in those countries," the economists wrote in a recent survey, "the goal of the U.S. multinational corporations' expanded production was to primarily sell to local customers rather than to reduce their labor costs for goods and services destined for sale in the U.S., Western Europe and other high-income countries."
This is a a point that needs to be stressed when we're talking about the "outsourced" jobs. In reality, there are many regions of the world that are growing at far more impressive rates than the US. In addition, these are new markets with an emerging middle class. That means is simply makes more sense to locate the factories and manufacturing facilities in these countries to sell to that market.
No Really -- CRA and the GSEs Weren't the Reason for the Collapse
For those of us in the economic blogsphere, Barry Ritholtz over at the Big Picture is a bit like a blogfather. He was one of the first economic bloggers who I read regularly. We've traded some occasional emails and he's always been very gracious.
His latest Washington Post column illustrates why he has such a great reputation: his research is exhaustive, which appeals to the academic side of me. His latest column for the Washington Post adds much more intellectual weight to the argument that the CRA and the other government GSEs weren't the cause of the financial mess.
Here are some salient points:
Then there's the question of where the bubble occurred:
And then there is this:
And that's the buzzer ending the game.
For those of you who still adhere to the CRA/GSE line of argument please do us a favor: don't reproduce.
And a special thanks to Barry for being intellectually rigorous at a time when our political and economic discourse is incredibly stupid.
His latest Washington Post column illustrates why he has such a great reputation: his research is exhaustive, which appeals to the academic side of me. His latest column for the Washington Post adds much more intellectual weight to the argument that the CRA and the other government GSEs weren't the cause of the financial mess.
Here are some salient points:
A McKinsey Global Institute report noted “from 2000 through 2007, a remarkable run-up in global home prices occurred.” It is highly unlikely that a simultaneous boom and bust everywhere else in the world was caused by one set of factors (ultra-low rates, securitized AAA-rated subprime, derivatives) but had a different set of causes in the United States. Indeed, this might be the biggest obstacle to pushing the false narrative. How did U.S. regulations against redlining in inner cities also cause a boom in Spain, Ireland and Australia? How can we explain the boom occurring in countries that do not have a tax deduction for mortgage interest or government-sponsored enterprises? And why, after nearly a century of mortgage interest deduction in the United States, did it suddenly cause a crisis?This is an incredibly good point, and should put the argument to bed for good: did the rest of the world have CRA legislation or GSEs" If not, why did these economies also experience an economic bubble?
Then there's the question of where the bubble occurred:
For example, if the CRA was to blame, the housing boom would have been in CRA regions; it would have made places such as Harlem and South Philly and Compton and inner Washington the primary locales of the run up and collapse. Further, the default rates in these areas should have been worse than other regions.So, prices spiked in neighborhoods that weren't the targets of the legislation. That's one powerful law if it can effect economic areas not intended to be effected.
What occurred was the exact opposite: The suburbs boomed and busted and went into foreclosure in much greater numbers than inner cities. The tiny suburbs and exurbs of South Florida and California and Las Vegas and Arizona were the big boomtowns, not the low-income regions. The redlined areas the CRA address missed much of the boom; places that busted had nothing to do with the CRA.
And then there is this:
•Nonbank mortgage underwriting exploded from 2001 to 2007, along with the private label securitization market, which eclipsed Fannie and Freddie during the boom. Check the mortgage origination data: The vast majority of subprime mortgages — the loans at the heart of the global crisis — were underwritten by unregulated private firms. These were lenders who sold the bulk of their mortgages to Wall Street, not to Fannie or Freddie. Indeed, these firms had no deposits, so they were not under the jurisdiction of the Federal Deposit Insurance Corp or the Office of Thrift Supervision. The relative market share of Fannie Mae and Freddie Mac dropped from a high of 57 percent of all new mortgage originations in 2003, down to 37 percent as the bubble was developing in 2005-06.The private market underwrote the vast majority of the sub-prime loans. These organizations weren't subject to the law.
•Private lenders not subject to congressional regulations collapsed lending standards. Taking up that extra share were nonbanks selling mortgages elsewhere, not to the GSEs. Conforming mortgages had rules that were less profitable than the newfangled loans. Private securitizers — competitors of Fannie and Freddie — grew from 10 percent of the market in 2002 to nearly 40 percent in 2006. As a percentage of all mortgage-backed securities, private securitization grew from 23 percent in 2003 to 56 percent in 2006
And that's the buzzer ending the game.
For those of you who still adhere to the CRA/GSE line of argument please do us a favor: don't reproduce.
And a special thanks to Barry for being intellectually rigorous at a time when our political and economic discourse is incredibly stupid.
Morning Market
Yesterday, the market sell-off continued:
The 5-minute charts clearly shows prices consolidating and then breaking support at the 123 level. Prices are now moving lower in a downward sloping channel.
When trading patterns -- like this topping triangle pattern -- the general rule of thumb is to measure the height of the pattern and the subtract or add that to the break-out point to get a price target. Here, the height is roughly 7 points (122-129), so our price target is in the 117 range.
I've added the Fibonacci levels for added measure.
I've added some of the technical indicators to the graph to show that overall, volume is weakening and the MACD is showing declining momentum, as well as giving a sell signal. In short, the weight of the evidence is clearly in the "market moving lower" camp. This jibes with the overall fundamental situation, which is also equity negative.
Oil has broken through its upward sloping trend line and is now trading around the 10 day EMA. While the EMA picture is still bullish, the 10 day EMA is now moving sideways, telling us the shorter trend is weakening. Also note the MACD has given a sell signal. The next level of support is around the 200 day EMA, where we also have previously established price levels.
Gold is still in the middle of a multi-year rally, with several trend lines currently supporting prices. However, notice that prices may be forming a topping pattern right now, indicating the rally may be over.
Supporting that view is the current 6-month daily chart, Notice there are two failed rallies, with the second topping below the first. Also note the weakening EMA picture, with the EMAs unable to show maintain a strong rally posture.
The 5-minute charts clearly shows prices consolidating and then breaking support at the 123 level. Prices are now moving lower in a downward sloping channel.
When trading patterns -- like this topping triangle pattern -- the general rule of thumb is to measure the height of the pattern and the subtract or add that to the break-out point to get a price target. Here, the height is roughly 7 points (122-129), so our price target is in the 117 range.
I've added the Fibonacci levels for added measure.
I've added some of the technical indicators to the graph to show that overall, volume is weakening and the MACD is showing declining momentum, as well as giving a sell signal. In short, the weight of the evidence is clearly in the "market moving lower" camp. This jibes with the overall fundamental situation, which is also equity negative.
Oil has broken through its upward sloping trend line and is now trading around the 10 day EMA. While the EMA picture is still bullish, the 10 day EMA is now moving sideways, telling us the shorter trend is weakening. Also note the MACD has given a sell signal. The next level of support is around the 200 day EMA, where we also have previously established price levels.
Gold is still in the middle of a multi-year rally, with several trend lines currently supporting prices. However, notice that prices may be forming a topping pattern right now, indicating the rally may be over.
Supporting that view is the current 6-month daily chart, Notice there are two failed rallies, with the second topping below the first. Also note the weakening EMA picture, with the EMAs unable to show maintain a strong rally posture.
Monday, November 21, 2011
Bonddad Linkfest
- Job polarization is increasing in the US
- China confirms spending plan of $1.7 trillion
- Is vocational training the answer?
- Eurozone prints a trade surplus
- Asian exports lower because of slower world growth
- Housing may be near a bottom
- Work sharing programs may be a good answer
- Wheat prices may have reached a floor
- Agricultural commodities bear brunt of speculator pessimism
- Nonferrous metal price declines continue
Subscribe to:
Posts (Atom)