we’re well on the way to creating a permanent underclass of the joblessThat is the most bothersome feature of this recovery: Yes, the economy is getting better and has been for some time. It now looks like the recovery is trying its d@#$edest to be self-sustaining. We're even adding 150,000 jobs or more a month on average now. But there remain about 8 million long-term unemployed and another 8 million long-term underemployed as a result of the Panic of 2008.


Industrial production declined 0.1 percent in February after having risen 0.3 percent in January; output in January was previously estimated to have edged down 0.1 percent. Manufacturing output increased 0.4 percent in February, and the gain in January was revised up to 0.9 percent. Outside of manufacturing, the output of mines rose 0.8 percent in February, which more than reversed its decline in January. However, the output of utilities fell 4.5 percent--the drop reflected unseasonably warm weather in February, which reduced the demand for heating after two months of unseasonably cold temperatures. At 95.5 percent of its 2007 average, total industrial production was 5.6 percent above its year-earlier level. The capacity utilization rate for total industry edged down 0.1 percentage point to 76.3 percent, a rate 4.2 percentage points below its average from 1972 to 2010.
In February, manufacturing output rose 0.4 percent, and over the past 12 months the level of factory production has climbed almost 7 percent. Capacity utilization for manufacturing moved up 0.2 percentage point to 74.3 percent, a rate 4.8 percentage points below its average from 1972 to 2010 but almost 9 percentage points above its trough in June 2009.The production of durable goods advanced 0.9 percent in February, and gains were widespread across its major categories. The output of motor vehicles and parts rose 4.2 percent following an increase of 4.5 percent in January; since December 2010, total motor vehicle assemblies have risen about 1 million units to an annual rate of 8.5 million units. Sizable gains also were recorded in February in wood products; nonmetallic mineral products; computer and electronic products; electrical equipment, appliances, and components; furniture and related products; and miscellaneous manufacturing. Among other industries, the indexes for fabricated metal products and for aerospace and miscellaneous transportation equipment recorded small increases, the index for machinery was unchanged, and the index for primary metals decreased.
Production in nondurable manufacturing was unchanged in February. Declines in the indexes for food, beverage, and tobacco products; chemicals; and plastic and rubber products were offset by gains elsewhere. Production in the non-NAICS manufacturing industries (logging and publishing) was down 0.8 percent.
In February, mining output rose 0.8 percent, and capacity utilization moved up 0.6 percentage point to 88.4 percent, a rate 1.0 percentage point above its average for the period 1972 to 2010. The gain in mining output largely reflected higher crude oil and natural gas extraction along with increased support activity for mining. The output of utilities dropped 4.5 percent, and the capacity utilization rate fell to 78.0 percent, a rate 8.5 percentage points below its average from 1972 to 2010.
Note that manufacturing output increased; increases in durables were "widespread" while non-durables were unchanged. In short, the inside numbers look solid.
Let's turn now to the Empire State numbers:
The Empire State Manufacturing Survey indicates that conditions for New York manufacturers continued to improve in March. The general business conditions index inched up 2 points, to 17.5. The new orders and shipments indexes fell but remained above zero, while the unfilled orders index rose above zero for the first time in a year. Price indexes continued to climb, suggesting that price increases had accelerated. Employment indexes were positive and above their February levels, indicating that employment had expanded. Future indexes were little changed, as respondents continued to be strongly optimistic about the six-month outlook, although future price indexes were sharply higher.
The overall index moved up a touch. This is not a massive move, but does indicate positive momentum. However, the new orders index declined, as did the unfilled orders index. Also note prices increased. Overall this is good news, but there are concerning internal developments that we'll have to keep a watchful eye on.
Finally, let's look at the Philly Fed:
Sharp acceleration in new orders is boosting the assessment of business conditions in the Philly Fed's manufacturing sector. New orders jumped more than 16-1/2 points in the March reading to 40.3, above zero to indicate month-to-month growth and far above February to indicate a sharp month-to-month acceleration in growth. Showing a 7-1/2 point gain to a very strong 43.4 is the general business conditions index, a reading that is not a composite but a single question on the sample's subjective assessment of month-to-month business conditions.
Other readings are also strong but mostly do not show acceleration relative to February. Shipments are nearly unchanged at a very strong 34.9; unfilled orders are unchanged at a what is a very strong 14.9 for this reading; price data show steady rates of pressure for both inputs and outputs; delivery times show a slight easing in delays; employment shows a slight month-to-month slowing in hiring.
Inventories show a major build relative to February in an indication that the region's manufacturers are scrambling to secure enough inputs for future output. Of special note is a more than 16 point jump to 63.0 for the six-month outlook.
This is also a strong reading with solid internals.
Overall, this week's data indicates the manufacturing sector is in good shape.
As an FYI, Kash over at the Street Light Blog has a few really good posts up about manufacturing. Here are the links
US Manufacturing is now leading
A Lean, Mean Manufacturing Machine
Winners and Losers in Manufacturing
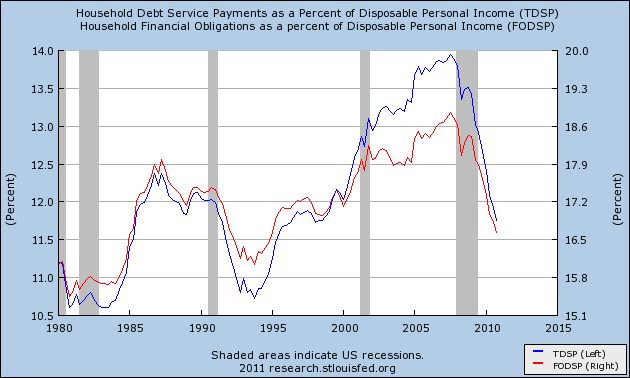
The household debt service ratio (DSR) is an estimate of the ratio of debt payments to disposable personal income. Debt payments consist of the estimated required payments on outstanding mortgage and consumer debt.Both measures declined substantially again, although by not as much as during most of last year. I've combined them into a single graph:
The financial obligations ratio (FOR) adds automobile lease payments, rental payments on tenant-occupied property, homeowners' insurance, and property tax payments to the debt service ratio.
Japan: One of the world's largest economics has had a devastating earthquake. 'Nuff said.Last year, Barry over at the Big Picture posted a story that Contrarian Edge argued Japan would be the first sovereign default. At that time, Japan had nearly a 200% debt/GDP ratio. Will they be able to fund recovery?
In essence, these pundits say Japan is on the brink of a bond market collapse that will result in the inability of the government to finance its debt which leads to a Greek scenario. Of course, what these people fail to recognize is that Japan is fundamentally different from Greece in that Greece is a currency user and Japan is a currency issuer. Whenever someone compares Japan or the USA to a Euro nation you should immediately dismiss them and stop reading their content – they clearly do not have even the most basic understanding of monetary systems.
.....Like the budget surplus in the USA in 1999 the surplus in Japan exacerbated the private sector debt problem as the public sector surplus resulted in private sector deficit. This ultimately resulted in en epic bubble collapse. Their solution was less than precise. Rather than take the Swedish approach the Japanese decided to let their banks earn their way out of the crisis. This only prolonged the inevitable deleveraging. This was combined with insufficient budget deficits that would have allowed the private sector to deleverage more quickly. This debt deleveraging resulted in anemic economic growth and persistent deflation. What ensued was a series of start and stop recessions and recoveries that happened to overlap with a difficult period of economic growth in many other parts of the world. As we all know it hasn’t been a pretty picture.
.....
There is, arguably, no better measure of a nations solvency than CDS prices. If you review the recent change in Japanese CDS you’ll notice that they are remarkably low considering the size of their public debt. You’ll notice that Greece and Ireland are more than 6 times higher than Japan currently (via Bespoke):
.....
What about their bond market? If you’ll recall the solvency crisis last year in Europe one of the defining characteristics of risk was surging yields. As I often say, there really are bond vigilantes in Europe. If there are vigilantes in Japan they sure are asleep on the job. Just look at Japan’s 10 year bond at 1.2%! It has actually declined in recent weeks. Investors clearly aren’t concerned about solvency. And rightfully so. There is no such thing as Japan running out of Yen.
Read the whole thing - it is well worth it.
U.S. stocks sank, erasing the 2011 gain for the Standard & Poor’s 500 Index, and Treasuries rallied as Japan’s nuclear crisis worsened. The yen rose to a 16-year high versus the dollar on speculation investors will buy the currency to fund rebuilding projects.
Given the findings described above, one can conclude that the likely indirect impacts of this horrific earthquake/tsunami event on growth in the Japanese economy will be quite minimal. The Japanese government and the Japanese people have access to large amounts of human and financial resources that can be directed toward a rapid and robust reconstruction and rebuilding of the affected region. Neither do we have any evidence to suggest that the earthquake is likely to have any enduring monetary effects.This observation, however, does not preclude enduring regional impacts. There is almost no research on this question, but some preliminary evidence suggests that similar large natural shocks can have important regional consequences. One widely mentioned prediction is that the population of New Orleans is unlikely to recover from the dramatic exodus of people from the region after Hurricane Katrina. Coffman and Noy argue that a similar and apparently semi-permanent decrease in population is observable for an Hawaiian island that was hit by a destructive hurricane in 1992.
In addition to these potentially permanent regional impacts, of course, this disaster may have impact on other macro-economic aggregates. The fiscal expansion that will follow this disaster will further increase the Japanese government's debt levels, but since this debt largely stays in Japan, and since households (especially credit-constrained households -- see Sawada and Shimizutani) are likely to 'tighten their belts' and reduce consumption temporarily, these other affects are unlikely to be enduring as well.
One caveat is worth mentioning here: We still do not know what will be the impact of the enfolding crisis in the various nuclear reactors that have been affected. The analysis above ignored this danger, though the still present devastation in Chernobyl attests to its potentially destructive powers.
In the medium and long run, many or all of these destroyed assets will be replaced. Some of the funds to do this will come from insurance companies, some will come from the Japanese government, and a substantial portion will come from the savings of individuals and corporations, who will have to dig into their financial assets to start replacing their lost physical assets. Thus we can expect savings rates in Japan to fall for both households and corporations.
And then, of course, these funds will be used to pay for the massive cleanup and rebuilding effort. If we assume that much of the rebuilding money will come from financial assets that would otherwise not have been spent right now, then we could easily expect to see an extra $50 to $100 billion in economic activity over the remainder of this year, largely or completely making up for the lost production of the disaster's immediate aftermath. Construction companies will be the first beneficiaries, of course, but so will producers of all sorts of other physical property that will have to be replaced, such as shipbuilders, car manufacturers, household appliance and electronic companies, and producers of all capital goods used by corporations to manufacture, sell, and distribute their products.
I therefore expect a fairly strong and broad-based economic recovery during the remainder of 2011 from what might be a very ugly Q1 figure for GDP growth in Japan. And if 2011 GDP is unchanged in total, but more of it is squeezed into the remaining three quarters of the year, that means that the pace of economic activity will have picked up. Who knows, it might even be enough to cajole the Japanese economy out of the decade-long deflationary spiral it has been trapped in. While no one would suggest that such an outcome would make worthwhile the horror that Japan is going through right now, let's hope that this disaster does end up leaving something at least slightly positive in its wake.
–At this stage, it’s too early to come up with meaningful estimates of the overall impact of the terrible events in Japan. And, in economic and financial terms, the effects may be dominated by other challenges facing the global economy, including still elevated oil prices and rising interest rates. And much still hinges on the radioactive threat to Japan’s more urbanised areas: if that threat fails to transpire, the [1995] Kobe quake provides a useful framework but if the worst happens, all bets are off. –Stephen King, HSBC
Japan's devastating earthquake and deepening nuclear crisis could result in losses of up to $200 billion for the world's third largest economy but the global impact remains hard to gauge five days after a massive tsunami battered the northeast coast.Goldman SachsAs Japanese officials scrambled to avert a catastrophic meltdown at a nuclear plant 240 km (150 miles) north of the capital Tokyo, economists took stock of the damage to buildings, production and consumer activity.
The disaster is expected to hit Japanese output sharply over the coming months, but economists warned it could result in a deeper slowdown if power shortages prove significant and prolonged, delaying or even scotching the "v-shaped" recovery that followed the 1995 Kobe earthquake.
Most believe the direct economic hit will total between 10-16 trillion yen ($125-$200 billion), resulting in a contraction in second quarter gross domestic product (GDP) but a sharp rebound in the latter half of 2011 as reconstruction investment boosts growth.
"The economic cost of the disaster will be large," economists at JP Morgan said. "There has been substantial loss to economic resources, and economic activity will be impeded by infrastructure damages (like power outages) in the weeks or months ahead."
Q1: What are the biggest differences between the March 11 and [1995] Hanshin earthquakes?
A1: The biggest difference is the widespread power outages this time.
Production is being halted due to power outages and voluntary power cutbacks by large customers. The longer this continues, the greater the impact on production will be. We estimate that if power outages continue until end-April, they would lower GDP growth by 0.5 pp, while outages to end-June would lower growth by 0.8 pp. We are still forecasting GDP growth of 1.2% in 2011. We are not revising our forecast at this juncture, but note the potential impact of continued power outages and the high level of uncertainty with regard to other factors (see Q6 below).
Q2: What are total damages from the earthquake likely to be?
A2: We estimate the damages will be around ¥16 trillion, surpassing the ¥10 trillion total from the Hanshin earthquake.
This total damage estimate refers to damage to the physical stock—buildings, production facilities, and the like. For the impact on GDP, a flow concept that reflects economic activity over a given period of time, see question 4.


U.S. companies’ cash hoard keeps getting bigger, a trend both good and troubling.After hitting new highs in five of the last six quarters, nonfinancial corporations’ cash and other liquid assets reached $1.9 trillion at the end of 2010, according to the Federal Reserve. That’s 7% of all their assets, the highest level since 1963.
Record earnings fueled by the highest profit margins since 1993 are giving executives more leeway than ever to boost dividends as the bull market enters its third year.Margins will climb to 8.9 percent in 2011, the highest level in at least 18 years, according to data compiled by Bloomberg on non-financial companies in the Standard & Poor’s 500 Index through March 11. Greater profitability combined with dividend cuts during the credit crisis have pushed earnings to 6.53 percent of the gauge’s price, or 3.5 times more than its payout rate, close to the record 3.6 multiple in January.
A total of 95 companies led by Aetna Inc. (AET) and Carnival Corp. have raised dividends as the fastest economic expansion in six years and five straight quarters of earnings growth increased confidence among chief executive officers. Of the 380 that pay dividends, 378 are forecast to maintain or increase them, according to data compiled by Bloomberg using options prices, profits, management statements and peer comparisons.
“The economy seems to be doing well and earnings are on the recovery path, which companies wanted to be sure about before they raised their dividends,” said John Carey, a Boston- based money manager at Pioneer Investments, which oversees about $250 billion. “I feel relatively confident that most of the dividends out there are secure, and we’ll see some fairly broad based increases.”
Companies have more than enough cash to pay for the increased cost of employment and companies are also profitable, meaning the pain from the recession is over. So -- where is the hiring?
There are several answers. First, there is a tremendous amount of slack in the labor force right now. Hours worked are low, meaning employers can simply increase the number of hours worked by current employees in order to increase production. In conjunction with that is the continued increase in productivity; companies are still getting more output from fewer employees, so they don't feel the need to hire.
Second, companies don't know if demand will stay elevated enough to continue to drive the economy. With consumer sentiment still very low (which is caused by high unemployment, the poor shape of the housing market and gas prices spiking), concern about the consumer's overall psychology is understandable.
Third, there is also legislative uncertainty. Let me paint an example. The new health care law is about 2000 pages; this is the same length of the condensed tax code that I use in my law practice that took me over three years to work through (in small pieces) in graduate school. While I am a slow reader (the bane of my legal existence), it still takes time to move through a code that deep and understand what it means. Then there is the movement from reading and understanding a law to implementing it over an extended period of time -- which, with the new law, takes place over a number of years. In short, the new law has fundamentally transformed the largest benefit offered to employees in more ways than we currently understand. This is preventing companies from moving forward. And, no, this is not my way of saying it's a bad law (frankly, I haven't read it nor do I understand health care law in any way). But it is my way of saying the uncertainty concept is not an academic construct; it is very real.


Recent world events are seen as a threat to the fragile economic recovery that is under way. Political unrest in North Africa and the Middle East has pushed crude oil and gasoline prices nearly 15 percent higher in the past month. Those higher prices could slow economic growth and curb commodity demand, including demand for agricultural commodities, he noted."Now the devastating earthquake and tsunami in Japan may challenge the Japanese and world economies, pointing to the possibility of a further slowdown in global demand growth," he said.

It's as if it finally dawned on consumers, during the first part of this month, that oil prices have been spiking and risk slowing the economy and raising inflation. The consumer sentiment report for mid-March is really very dramatic, showing a 68.2 composite index which compares with 77.5 for the full month of February but is down even further, perhaps a dozen points or more, compared to the recovery-best strength during the second half of February. The weakness is centered in the leading component, the expectations index which fell more than 13 points to 58.3. This points to increasing overall weakness in future readings.
China unexpectedly posted a trade deficit in February, according to official data released Thursday, and economists said this could reduce pressure on the country to allow its currency to appreciate.The rate of growth for both import and export indicators tapered off considerably from the levels seen in January, distorted by the Chinese New Year holidays during the month.
China’s wholesale prices accelerated in February while consumer prices gained at faster rates than forecast, indicating authorities have more work to do in their battle to keep prices in check.The monthly consumer price index rose 4.9% in February, unchanged from the reading in January but higher than the 4.8% increase expected in estimates compiled by FactSet Research.
These two stories indicate the following:
1.) For the last year, China has been raising reserve requirements and issuing orders to curtail lending. These are not working. China will more than likely have to engage in far more aggressive means to slow the economy -- such as raising interest rates -- to lower inflation. This means the economy driving world growth will see a slowdown, which could have repercussions for the world's recovery.
2.) With China's showing a trade deficit, expect international pressure on China to let the Yuan rise to slow. While the deficit's drop is probably temporary, the reality is you never know with economics; we could be witnessing a fundamental change.
Japan: One of the world's largest economics has had a devastating earthquake. 'Nuff said.
Last year, Barry over at the Big Picture posted a story that Contrarian Edge argued Japan would be the first sovereign default. At that time, Japan had nearly a 200% debt/GDP ratio. Will they be able to fund recovery?
Debt Downgrades: Two EU countries had their debt ratings downgraded last week.
Moody’s Investors Service cut Greece’s sovereign-debt rating Monday by three notches to B1, infuriating the Greek government and temporarily denting the euro amid renewed worries about the ability of Greece and other debt-loaded euro-zone governments to avoid default.The ratings agency, which also assigned a negative outlook to Greece’s ratings, highlighted the government’s difficulties with revenue collection and noted a risk that Athens might not meet the criteria for continued support from the International Monetary Fund and the European Union after 2013.
That could result in a voluntary restructuring of existing debt, the ratings agency said. Last June, Moody’s cut Greece's rating from A3 to junk status at BA1.
Spain moved back into the spotlight of Europe’s long-running debt crisis Thursday as Moody’s Investors Services cut the Spanish government’s debt rating.The rating was downgraded one notch to Aa2 from Aa1, bringing it in line with the rating offered by Standard & Poor’s. Moody’s put the new rating on negative outlook, a signal that a further cut is possible.
Those are two large shocks to occur in short order. This leads to the broader problem of will the markets finally buy into the EU's solution?
Last year, the EU crisis what the primary reason for a slowdown in the economy. Are the items listed above sufficient to do the same? Obviously, no one knows for sure. However, that's a lot of trouble in a short period of time.