Wednesday, April 16, 2008

Translating "Fedspeak"

I am traveling today and may not get to a today's market until tomorrow morning.

Yesterday the Federal Reserve released the Beige Book which provides an excellent overview of current economic conditions. So, let's dig in. I'm going to offset the Fed's information and italicize the words.

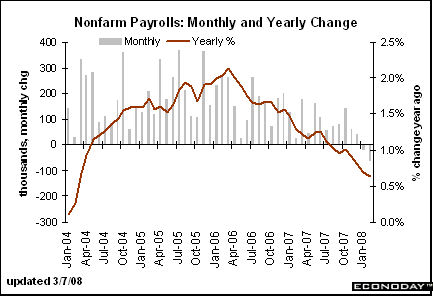
Despite some variation across Districts, employment levels appeared to be little changed, on balance, from recent months. Some weakening in the job market was reported in the New York, Atlanta, Chicago, St. Louis, and Minneapolis Districts. Cleveland reported flat employment levels, while Richmond indicated mixed trends. Boston and Kansas City indicated modest increases in employment, with some deceleration indicated in the latter. Firms in the Philadelphia, Atlanta, and Minneapolis Districts reported layoffs, reductions in work hours, or hiring freezes in response to current or expected slowing in economic activity.
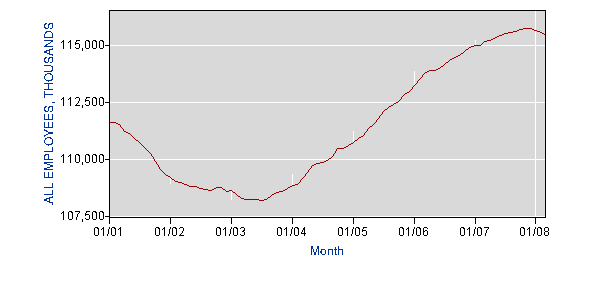


Above is a graph of establishment job growth. Notice we're just at the beginning of problems in the labor market. In addition, job growth during this expansion has been the weakest of any post WWII expansion. This implies we won't see the same level of lay-offs as we've previously seen in the economy.
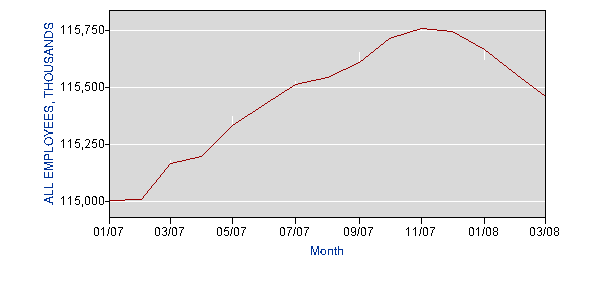


Above is a one year chart of employment growth. Notice we're only at the very beginning of a slowdown.
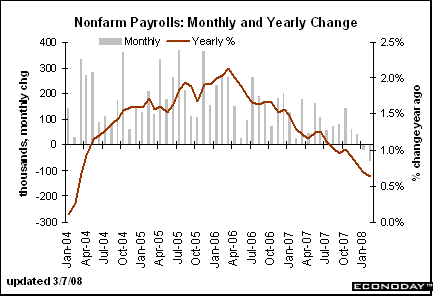


However, as the above your-over-year percentage change indicates, we've been experiencing some problems for some time.
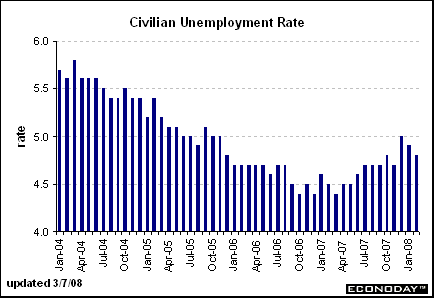


And we're also seeing an uptick in the unemployment rate.

Consumer spending weakened in most, but not all, Districts since the last report. In particular, automobile sales were generally reported to be flat or declining. Vehicle sales were described as unchanged or falling in the Philadelphia, Cleveland, Atlanta, and Dallas Districts and were characterized as weak in the Richmond, Atlanta, Chicago, and San Francisco Districts. However, Kansas City reported that auto sales rebounded in March, though they remained lower than a year earlier. Non-auto retailers reported that sales were sluggish or declining in ten Districts. Elsewhere, Boston noted mixed sales trends, and New York reported a modest pickup since the last report. Chicago, San Francisco, and, to a lesser extent, Philadelphia noted relative strength in demand for luxury goods.


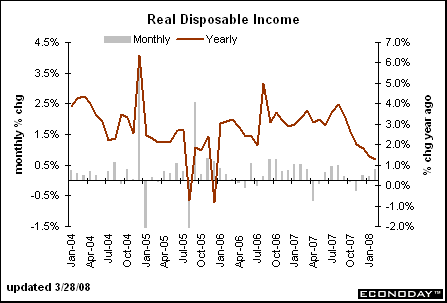
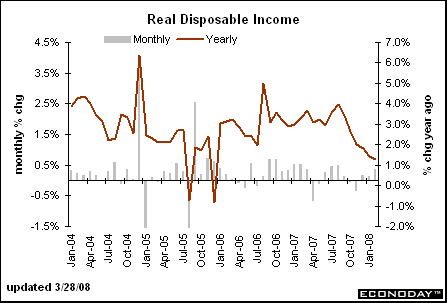
As a result of weak job growth (see above), we've see weak wage growth


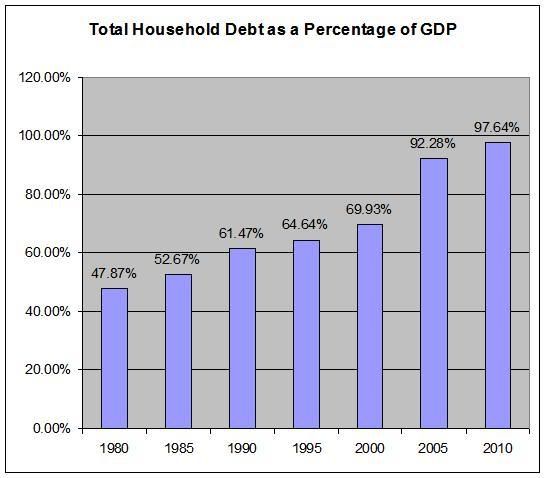
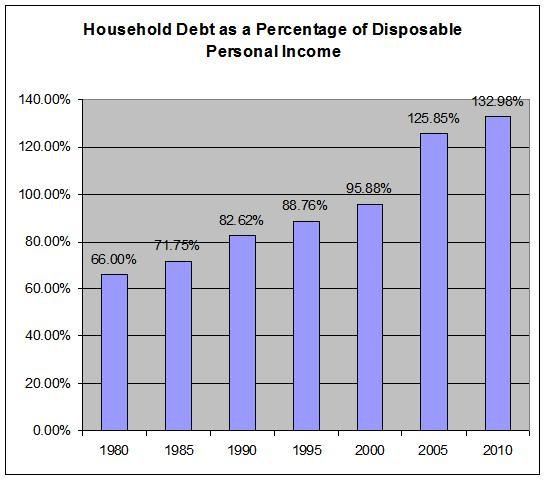
Don't forget the high levels of household debt, which I think have now become enough of a burden to slow spending.


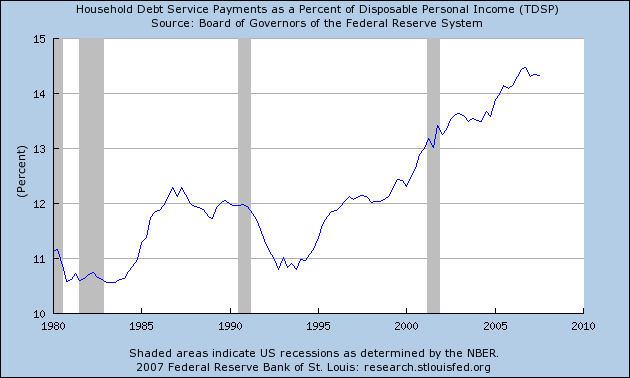
Debt service payments have been increasing for the last few years


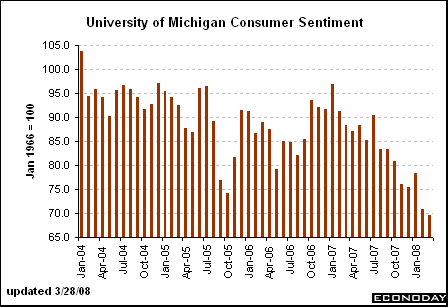
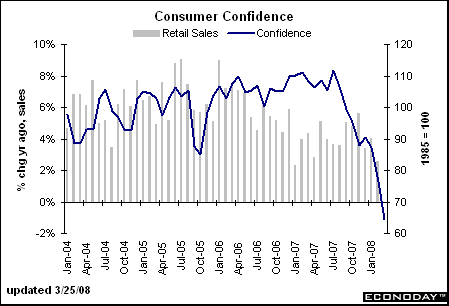
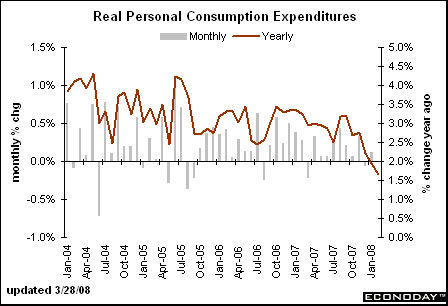
All of this leads to declining spending
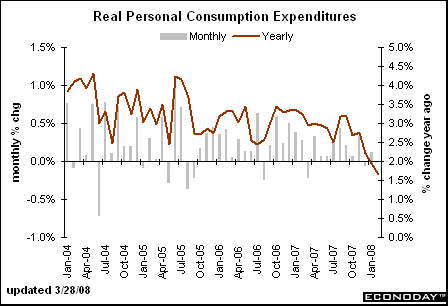


And somewhat stagnant retail sales for the last few years or so
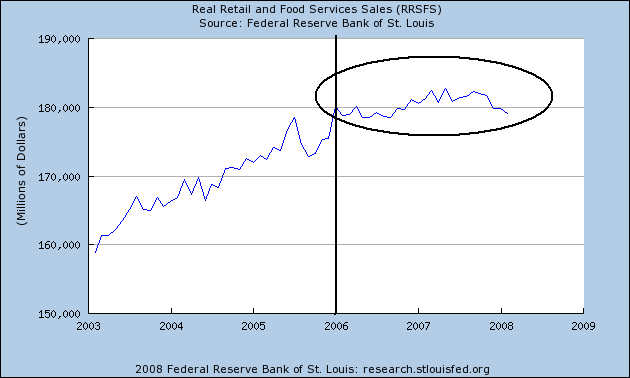


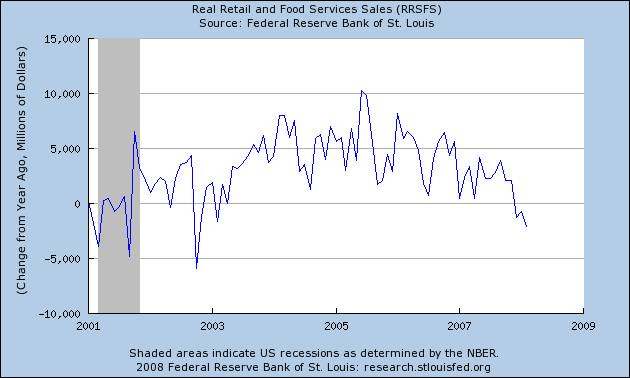
With a declining year over year number


Manufacturing activity was varied, with some Districts reporting a slight increase in activity, some indicating weaker activity, and several noting that activity was mixed or had held steady. Chicago, Boston, and Richmond reported that activity was rising, but not substantially, while New York, Kansas City, Philadelphia and Dallas all reported that activity had weakened. St. Louis and Cleveland said that activity had held steady, while Atlanta, Minneapolis and San Francisco saw activity as mixed.


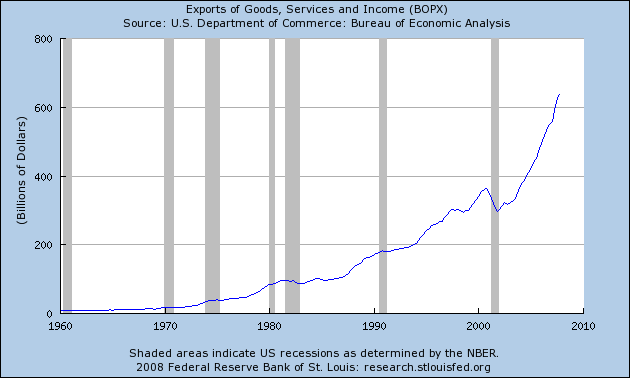
Remember, the main story here is the weaker dollar:
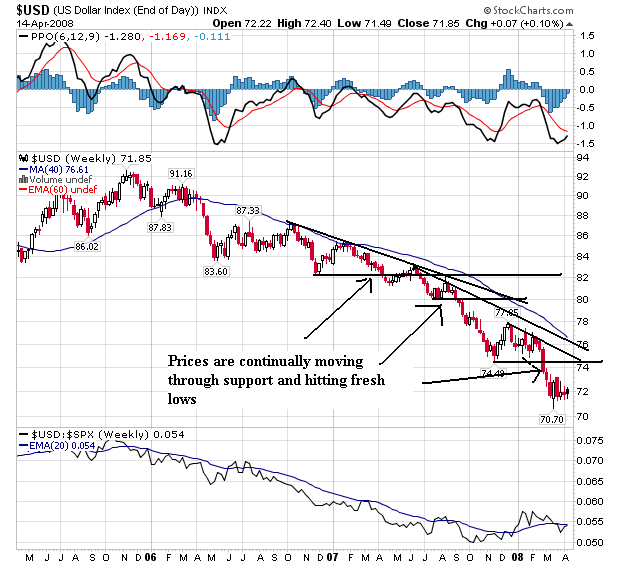


Which has lead to an increase in exports:


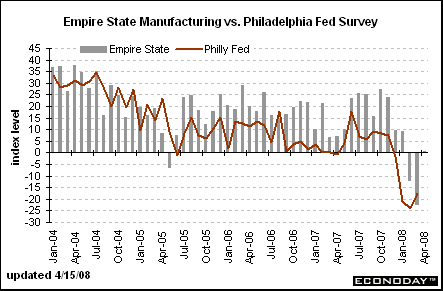
But the slumping domestic economy is still hurting manufacturing as shown by the following regional indexes:


Housing markets and home construction remained sluggish throughout most of the nation, though there were few signs of any quickening in the pace of deterioration. Ongoing weakness in housing markets, in general, was reported in almost all Districts. Sales activity was generally reported to be declining in the Boston, New York, Philadelphia, Atlanta, St. Louis, Minneapolis, Dallas and San Francisco Districts, while Kansas City and Chicago noted slack demand and excess inventories. On the other hand, the Cleveland District saw some pickup in activity, while Richmond and Atlanta reported some pockets of improvement; Boston, Atlanta, and Chicago cited some recent pickup in traffic or buyer inquiries. New residential construction was reported to have remained at depressed levels, and none of the Districts reported any pickup since the last report.


First, there is a ton of inventory on the market. Here is a chart of total existing inventory from Calculated Risk
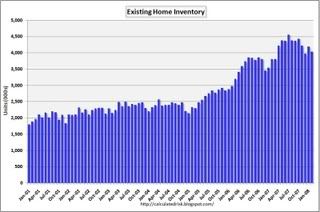


Notice in the story above economists were predicting 750,000 to 1 million more homes will hit the market in the next year as a result of the increase in foreclosures. That means at minimum we'll see no meaningful drop in inventory over the next year.

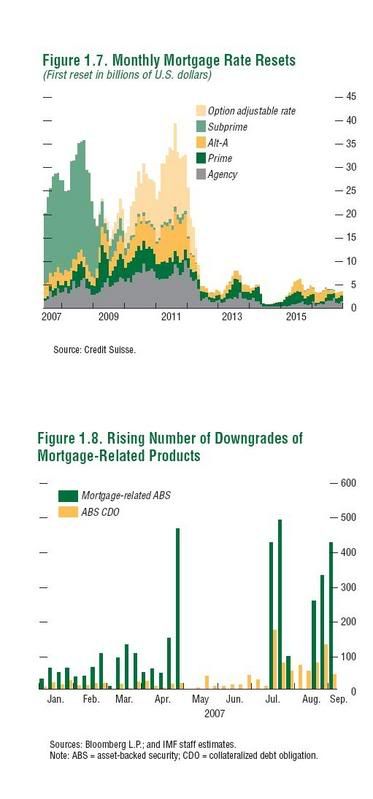
And here is a chart from CSFB that shows we're nowhere near the end of foreclosures related to changing mortgage terms. In fact, we have a second wave to go through in about a year and a half:


At the same time, the US consumer is in debt up to his eyeballs and can't afford to talk out much more debt.


So -- there is little reason to think inventory will decrease in the coming year and there is little reason to think people will rush into the housing market because they are already under a tremendous amount of debt.

So -- what does that mean for prices? If inventory isn't decreasing and fewer people are able to take out a loan that means prices will have to drop. And considering how out-of-whack home prices are anyway, that shouldn't be much of a surprise:
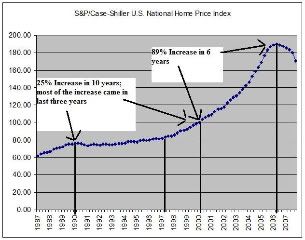


Compare the 1990s with the 2000s (but also remember we were working on another bubble in the 1990s). Despite the fact that things were good in the 1990 we didn't see a huge increase in prices. However, we made up for lost time in the 2000s. Simply put, prices are going to drop before they move higher.

Business contacts across all Districts continued to report increases in input costs and output prices. In particular, price increases were consistently reported for food products, fuel and energy products, and many raw materials. More specifically, increases in the price of chemicals, metals, plastics and other petroleum-based products were commonly cited. Most manufacturers have or are planning to increase prices in response to rising input costs, while the response of service firms has been more mixed, in part due to differences in competitive pressures. On balance, input costs have risen more rapidly than output prices, putting pressure on margins for many firms. Most Districts reported little change in retail price inflation, though Richmond and San Francisco noted some moderation. Most business contacts reported that wages were unchanged or were increasing moderately in all Districts. Business contacts in the Atlanta, Chicago, Cleveland, Dallas, Philadelphia, and San Francisco Districts indicated that there has been some upward wage pressure for skilled labor in some sectors that continue to experience shortages.


For anyone who reads my blog on a regular basis, you should know that inflation is nowhere near under control. Here's one example and here's another example.

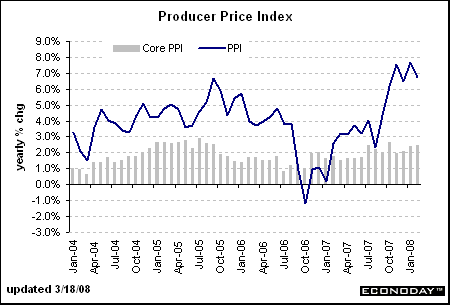
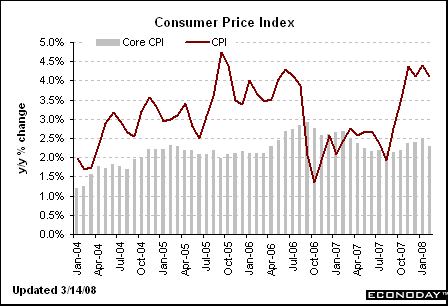
However, for those of you who have forgotten, here are the relevant year-over-year charts.
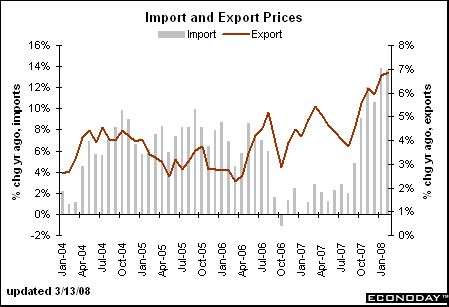


So -- the short version is the economy is slowing and inflation is rising. Not a good combination.

Charts from Econoday

Today's Markets

More bad news on the inflation front. First, oil crossed the $115/bbl mark for the first time. Gasoline also settled at a record price (the dollar falling to a new low versus the euro didn't help matters). We also learned the year-over-year CPI rose 4%. Housing continues to struggle as housing starts fell to their lowest level in 17 years. And in the financial world, JPM Morgan's earnings dropped 50% and there are rumors that Merrill's writedowns this month could total $8 billion.


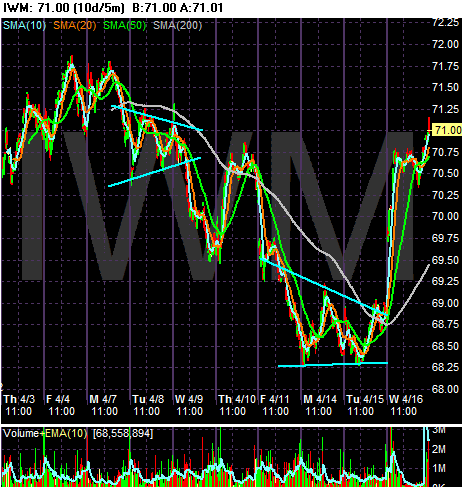
I'm using the 10-day chart to put today's rally in perspective. First, the market has been dropping since April 7. In baseball parlance, "we were due." Also note that in one day the market rallied enough to wipe out 50% to 75% of the drop. That means the market was probably oversold; traders were just looking for a reason to buy. Bottom line -- pulling the view point back to a longer perspective and we can see this wasn't the best rally out there. Now -- if we see the market continue to make strong moves like this over the next few weeks, then we'll be onto something.

What Inflation?

From Bloomberg:

European inflation accelerated more than initially estimated in March, reinforcing the European Central Bank's resistance to cutting interest rates even as economic growth cools.

The inflation rate rose to 3.6 percent last month, the highest in almost 16 years, the European Union's statistics office in Luxembourg said today. The March figure is up from 3.3 percent in February and exceeds an estimate of 3.5 percent published on March 31.

Food and energy prices stoked inflation in March, and the euro extended its gains after the report, rising to a record against the dollar. ECB Executive Board member Juergen Stark yesterday said interest rates may not be high enough to contain inflation, while Greek colleague Nicholas Garganas said price pressure ``is more intense than previously foreseen.''

``Concerns about upside risks to the inflation outlook are unlikely to ease quickly, leaving little, if any, scope for the ECB soften its interest-rate stance,'' said Martin van Vliet, an economist at ING Group in Amsterdam. ``This may help push the euro-dollar to $1.60 in the short term.''

....

Food-price inflation accelerated to 6.2 percent in March from 5.8 percent in February, the highest since Eurostat began the current series in 1997. Rice climbed to a record $22.67 per 100 pounds today on rising demand and as floods delayed planting in the U.S. Wheat, corn and soybeans also have risen to records.

Energy-price inflation accelerated to 11.2 percent from 10.4 percent, the highest since May 2006. Crude oil has risen 79 percent in the last 12 months and reached a record above $114 a barrel yesterday.


First, notice that at least we're not the only country that is dealing with spiking inflation.

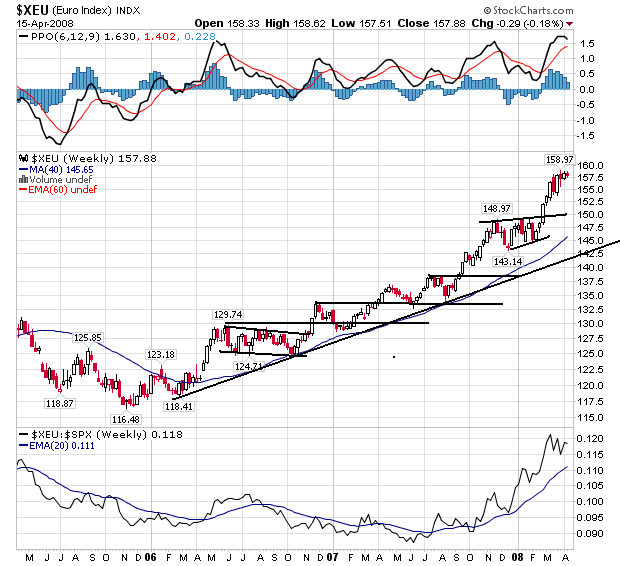
Secondly, notice the European Response -- not raising rates. The reason is the European Central Bank (ECB) is less concerned with preventing a recession. Instead, they view their mandate as inflation fighters or as promoters of price stability as extremely important. As a result, the euro is rallying:


On the chart, notice the following:

-- Prices have been rallying since 2006

-- Prices have continually moved through previous levels of resistance to hit new levels.

-- After hitting new levels prices consolidate, shaking out some players who take profits and inviting new players in to take new positions.

From Bloomberg:

Rice climbed to a record for a second day as the Philippines, the world's biggest importer, sought 1 million metric tons and floods delayed planting in the U.S., increasing concern of a global shortage.

The Philippines will hold a tender tomorrow for 500,000 tons of rice, with another to follow on May 5. A March tender filled just 61 percent of requirements at prices double those six months earlier. Last year, the country imported 1.9 million tons of rice, equivalent to about 15 percent of annual needs. Food lines have formed as people wait for rice.
Rice in Chicago surged 2.3 percent today to $22.67 per 100 pounds on rising demand and export curbs from some producing nations, stoking global concern about inflation and the potential for social unrest. Rice, the staple food for half the world, has more than doubled in a year. Wheat has gained 93 percent in that time, while corn is up 61 percent.

``We've seen an unprecedented bull run in rice prices,'' Luke Chandler, senior commodities analyst at Rabobank Group, said in an interview today with Bloomberg Television. ``It's almost becoming like a supply shock because the countries that rely on the imports aren't able to access the available sources.''


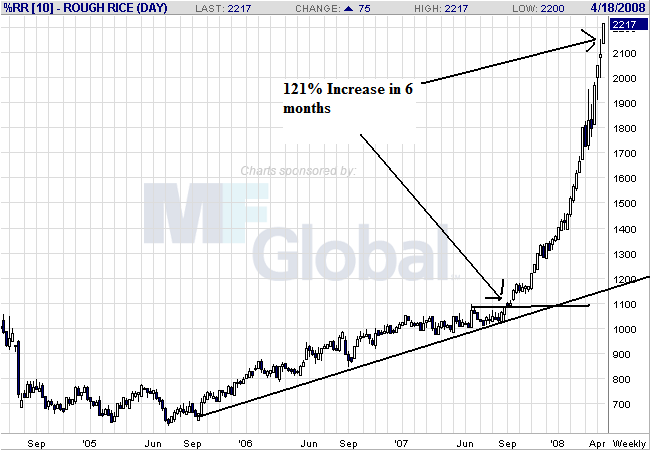
Here's a chart:


Notice the extreme price spike in rice's price. This is an unsustainable move up in the long run -- meaning prices are really over-extended. But the problem is there is panic buying going on which will really spike prices hard in the short run. As a result, don't be surprised to see rice continue to move higher.

But it's not just rice:

U.S. rice, corn and crude futures soared to record highs Tuesday on supply concerns, in turn boosting gold on inflation worries.

On the New York Mercantile Exchange, the front-month crude settled up $2.03, or 1.82%, at $113.79 on a combination of supply issues, rising diesel demand in China and persistent dollar weakness. Crude futures later rose to a record high of $114.08 after settlement.

Rice and corn futures rocketed to all-time highs on tight world grain supplies and planting delays, with the rally in crude providing an additional boost to grains.

Chicago Board of Trade rice prices have doubled since last September, with Asian prices soaring even more sharply since January as big importers have rushed to build stocks on fears that supplies will become scarce as exporters clamp down on shipments.


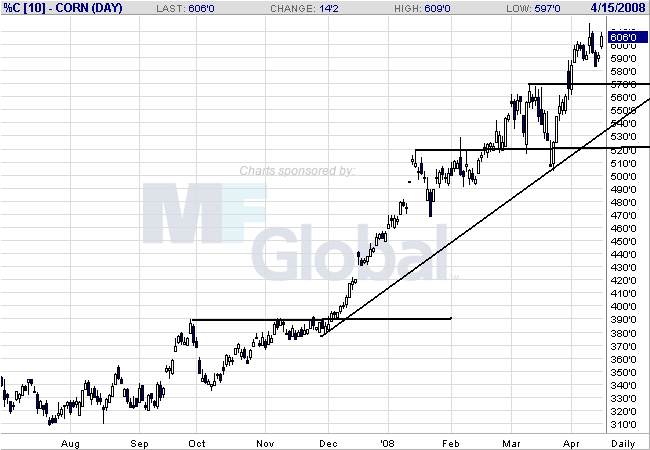
Here is a chart of corn:


Notice prices are in a solid uptrend; they have moved through previously established resistance to establish new highs and then have sold-off to previously established upward sloping trend lines. This is a bullish chart.


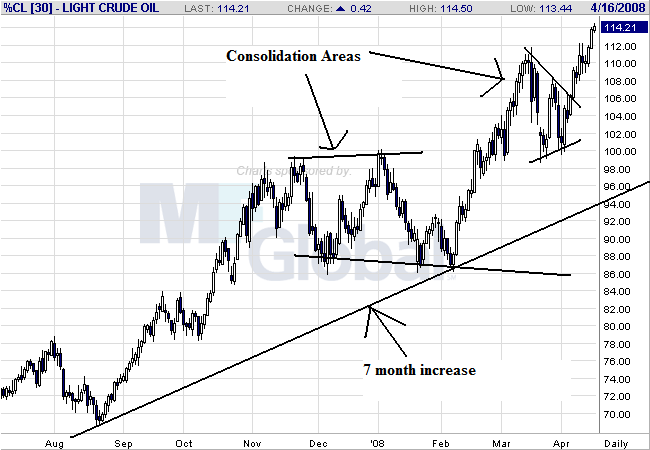
Notice that oil has the same pattern as corn; prices have continued to rise, consolidate gains and then continue to move higher. Oil has a clear support level as well.

A Closer Look At the Treasury Market

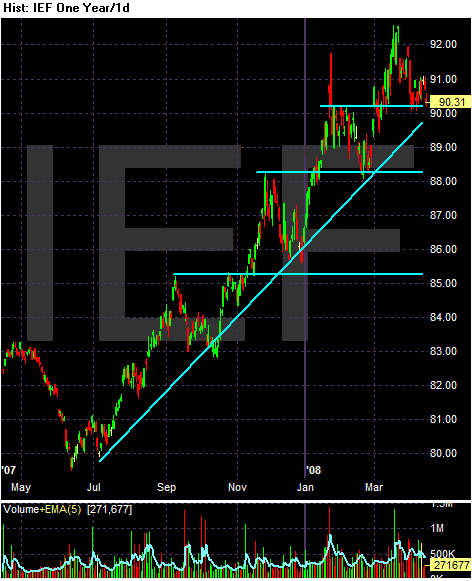
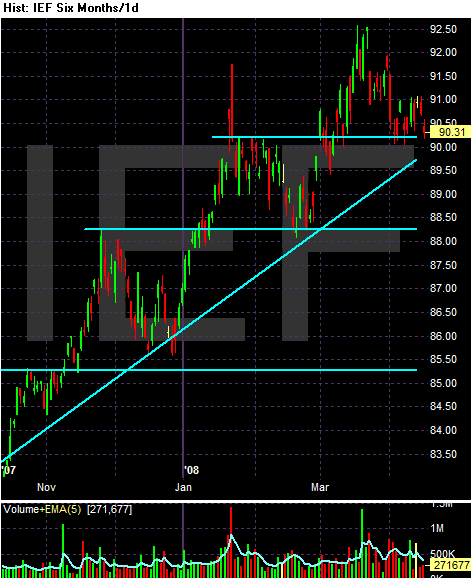
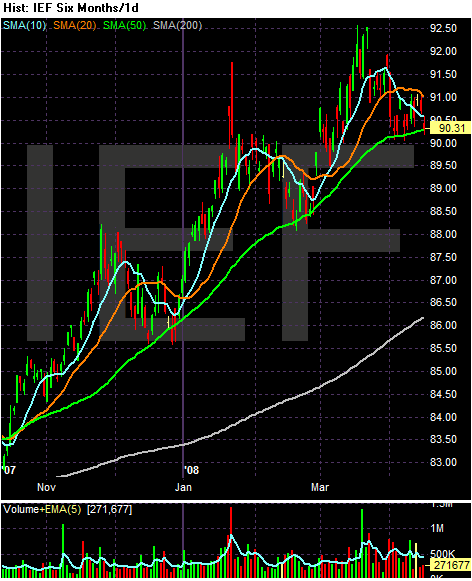
It's been awhile since I've looked at the Treasury market, so let's take a gander. I'll be using the 7-10 year Treasury market chart as a proxy.


On the 1 year chart, notice the prices have been in a clear uptrend, continually making new highs by breaking through previous resistance levels. This is a solidly bullish chart.


On the six month chart, notice that prices rise then sell-off a bit after hitting new peaks. This is healthy.


On the six month SMA chart, notice the following:

-- Prices have continually bounced off the 50 day SMA as support

-- The 50 day SMA has continually moved higher.

-- The 10 and 20 have consistently been above the 50 day SMA, although the 10 and 20 have intertwined over the same period.

Tuesday, April 15, 2008

Today's Markets

Delta and Northwest announced they were merging (maybe this means they'll actually give passengers more room in their damn airplanes. United and continental said a deal between them is also a possibility. With oil and gas still rallying more mergers in the airline business will probably be in the works. Johnson and Johnson reported an earnings increase. On the housing front, we learned that Southern California home values dropped 24% from the previous year. And we saw the New York Fed manufacturing number increase although it's important to remember the overall trend is still down.


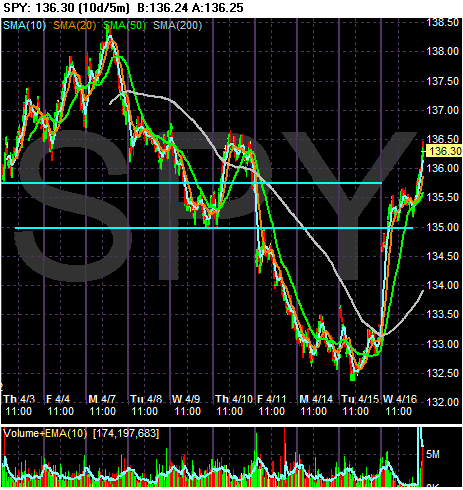
For the last two days, the SPYs have been in a trading range.


And that trading range may be at the end of a sell-off that started last week. In other words, the market may be making a short-term bottom here.


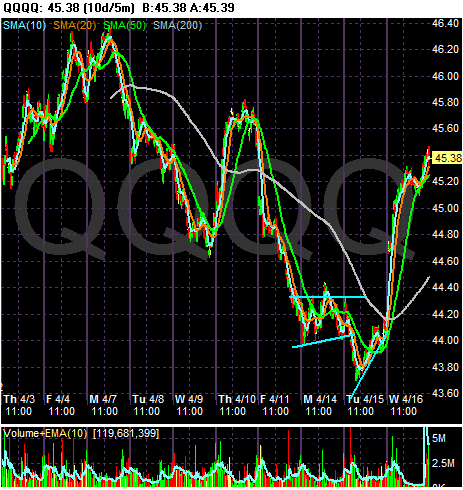
however, the QQQQs aren't showing any clear reversing formation here

>

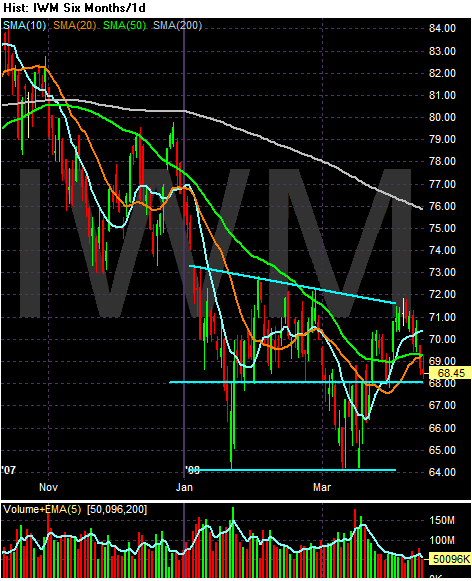
But the Russell 2000 most certainly is.

What Inflation?

From the BLS:

The Producer Price Index for Finished Goods increased 1.1 percent in March, seasonally adjusted, the Bureau of Labor Statistics of the U.S. Department of Labor reported today. This advance followed a 0.3-percent rise in February and a 1.0-percent increase in January. At the earlier stages of processing, prices received by producers of intermediate goods rose 2.3 percent after increasing 0.8 percent a month earlier, and the crude goods index advanced 8.0 percent following a 3.7-percent rise in February.

Among finished goods, the increase in the index for energy goods accelerated to 2.9 percent in March from 0.8 percent in the preceding month. Prices for finished consumer foods turned up 1.2 percent after declining 0.5 percent in February. By contrast, partially offsetting the acceleration in finished goods prices, the rise in the index for finished goods less foods and energy slowed to 0.2 percent from 0.5 percent in February.


For God's sake -- can we please get off the "ex-food and energy" crap? I know of no one -- and I MEAN NO ONE -- who is not effected by food and energy prices. Over the last week we have seen earnings reports cite increasing energy costs as a price reason why profit growth is slowing. And yet the BLS is still trying to tell us that "ex food and energy" prices are decreasing. Please, stop this spin now. I want to get off.

All that being said, notice the increasing rate of prices all through the first paragraph. You can thank rising energy prices for most of it. But regardless of the reason, it looks like we're in for a less than fun ride on the inflation roller coaster.

We're Nowhere Near the Bottom In Housing

From the AP:

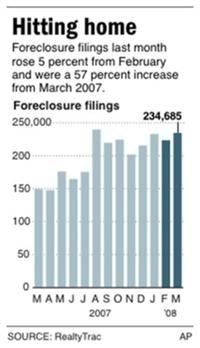
The number of U.S. homes receiving at least one foreclosure filing jumped 57 percent in March to 234,685, compared with 149,150 properties a year earlier. Filings include default notices, auction sale notices and bank repossessions.

The overall foreclosure rate is 5 percent higher than in February, which saw an unexpected month-to-month decline over January. March marked the 27th consecutive month of year-over-year increases in national foreclosure filings.

That meant one in every 538 households received a filing during the month. Forty-four percent were households that slipped into default for the first time and more than a fifth were homes banks took back.

Lenders took possession of homes at a sharply higher rate, up 129 percent over last year, as more homeowners relinquished their homes, said Sharga. Banks repossessed 51,393 properties nationwide, many of them without a public foreclosure auction.

"In a lot of cases, banks worked something out with the owner in advance and took back the keys and deed. For a homeowner, it's not as embarrassing and it's a little less of a blemish on their credit record compared to a foreclosure," Sharga said.

He estimates between 750,000 and 1 million bank-owned properties will hit the market this year, or about a quarter of the homes up for sale. In some areas, these properties will continue to slow sales and depress prices further.


The article had an accompanying graph:


Here's my thought pattern on housing -- and it hasn't changed much over the last 6 months or so.

First, there is a ton of inventory on the market. Here is a chart of total existing inventory from Calculated Risk


Notice in the story above economists were predicting 750,000 to 1 million more homes will hit the market in the next year as a result of the increase in foreclosures. That means at minimum we'll see no meaningful drop in inventory over the next year.

And here is a chart from CSFB that shows we're nowhere near the end of foreclosures related to changing mortgage terms. In fact, we have a second wave to go through in about a year and a half:


At the same time, the US consumer is in debt up to his eyeballs and can't afford to talk out much more debt.


So -- there is little reason to think inventory will decrease in the coming year and there is little reason to think people will rush into the housing market because they are already under a tremendous amount of debt.

So -- what does that mean for prices? If inventory isn't decreasing and fewer people are able to take out a loan that means prices will have to drop. And considering how out-of-whack home prices are anyway, that shouldn't be much of a surprise:


Compare the 1990s with the 2000s (but also remember we were working on another bubble in the 1990s). Despite the fact that things were good in the 1990 we didn't see a huge increase in prices. However, we made up for lost time in the 2000s. Simply put, prices are going to drop before they move higher.

Monday, April 14, 2008

Everything You Wanted to Know About Credit Default Swaps -- But Were Afraid to Ask

Credit default swaps have been getting a tone of ink lately for a variety of reasons. To hear some people talk about them you'd think they were the second coming of the anti-Christ. I was recently on a conference call with George Soros who doesn't like them at all. However, people once thought the same thing about options which are now a standard method of hedging risk. So, let's see what all the hubbub is about.

Let's assume that a money manager buys a GE bond, that matures in exactly 5 years and has a coupon of 5%. It pays interest semi-annually. This is a standard trade for a ton of money managers. Let's assume the manager wants to hedge the downside risk on the bond -- that it, he wants an insurance policy in case GE goes belly-up. Before CDS this didn't exist unless the bond itself was actually insured -- that is it was backed by AMBAC or MBIA or a similar bond insurer. However with a CDS the manager can now insure against the downside risk. How? I'm glad you asked:

In a CDS, one party "sells" risk and the counterparty "buys" that risk. The "seller" of credit risk-who also tends to own the underlying credit asset-pays a periodic fee to the risk "buyer." In return, the risk "buyer" agrees to pay the "seller" a set amount if there is a default (technically, a credit event). CDS are designed to cover many risks, including: defaults, bankruptcies and credit rating downgrades (For a more detailed list of CDS credit events see the Commonly Established CDS Credit Events table below).


This is not a very complicated issue. The person who wants the insurance pays another party for insurance. The "insurer" guarantees to pay the "insured" X amount of dollars in the event the bond defaults. The cost of the insurance will depend on a host of factors such as the credit worthiness of the bond issuer, the interest rate (which is also a sign of credit-worthiness), the length until maturity and a few other factors.

The primary criticism against CDS' are best expressed by Warren Buffet:

Warren Buffett famously described derivatives bought speculatively as "financial weapons of mass destruction." In Berkshire Hathaway's annual report to shareholders in 2002, he said "Unless derivatives contracts are collateralized or guaranteed, their ultimate value also depends on the creditworthiness of the counterparties to them. In the meantime, though, before a contract is settled, the counterparties record profits and losses -often huge in amount- in their current earnings statements without so much as a penny changing hands. The range of derivatives contracts is limited only by the imagination of man (or sometimes, so it seems, madmen)." The same report, however, also states that he uses derivatives to hedge, and that some of Berkshire Hathaway's subsidiaries have sold and currently sell derivatives with notional amounts in the tens of billions of dollars.


Let's use a comparison to options as a way to explain what Buffet is talking about. Let's say someone owns 100 shares of GE. If they want to they can sell either a single put or call contract against those 100 shares. This would be a "colateralized" position because there is collateral backing up the options contract the person is writing.

What Buffet is talking about is a "naked contract" where the person writing the contract does not have the underlying security. In the preceding example, it would mean the person writing the GE options does not own any GE stock. That means that everything is great until the person has to actually provide the GE stock to the party who bought the option. This is why the person's underlying credit is so important. If he has good credit than he either has the money to buy the stock or can borrow the money to buy the stock. However, if he doesn't have a good credit rating, then we're in serious trouble.

And that's where the real rub comes in. According to the latest Flow of Funds report, total corporate credit outstanding is about $6.3 trillion and total corporate borrowing outstanding is about $10 trillion. But, the size of the CDS market is a lot bigger:

The CDS market exploded over the past decade to more than $45 trillion in mid-2007, according to the International Swaps and Derivatives Association. This is roughly twice the size of the U.S. stock market (which is valued at about $22 trillion and falling) and far exceeds the $7.1 trillion mortgage market and $4.4 trillion U.S. treasuries market, notes Harvey Miller, senior partner at Weil, Gotshal & Manges. "It could be another — I hate to use the expression — nail in the coffin," said Miller, when referring to how this troubled CDS market could impact the country's credit crisis.


The amount outstanding is far larger than the total corporate debt outstanding. That tells me financial players saw a way to make money and went for broke.

I think CDS are a healthy development. Bond investors have needed some type of option style investment for some time. In fact, I'm surprised it took this long for them to develop.

However, the current size of the CDS market tells there's something fundamentally out of whack right now. I think the main thing that needs to happen is for a CDS exchange to develop where everybody can get quotes on all sorts of instruments. We have the CBOT and the CME why not an exchange that deals is CDS? It's the next logical step.

Today's Markets

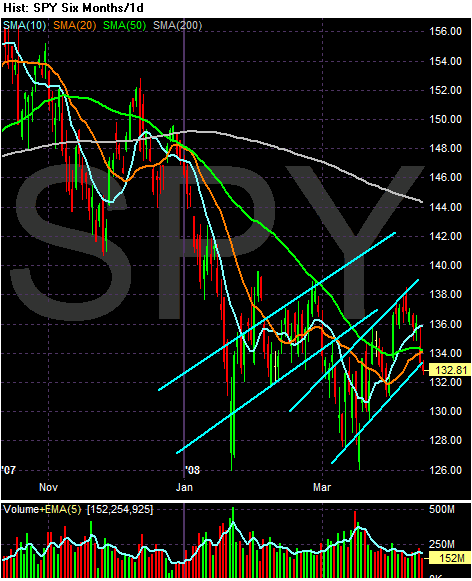
Instead of using the daily 5-minute chart, I'm going to use the 6-month daily chart to show how the market is doing.


Notice the following:

-- The market is stuck between (broadly) 128 and 138.

-- We have two upward sloping pennant formations

-- The SPYs are about 7.8% below the 200 day SMA

-- The 10 and 20 day SMA are moving higher, but

-- Prices are now below these two averages which pull the shorter SMAs lower

-- The SMAs and prices are bunched up without a clear sense of direction.


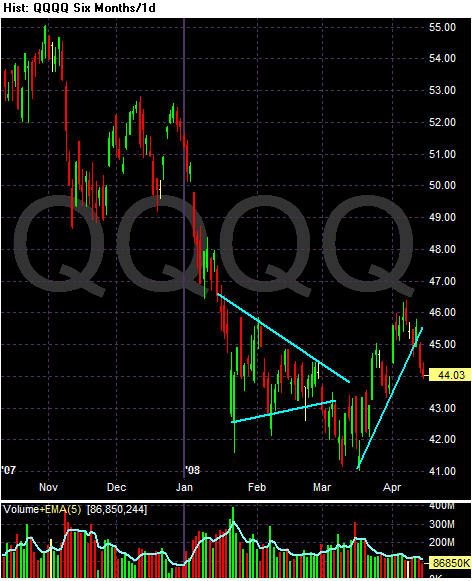
On the QQQQs, notice that the average just broke a month-long uptrend


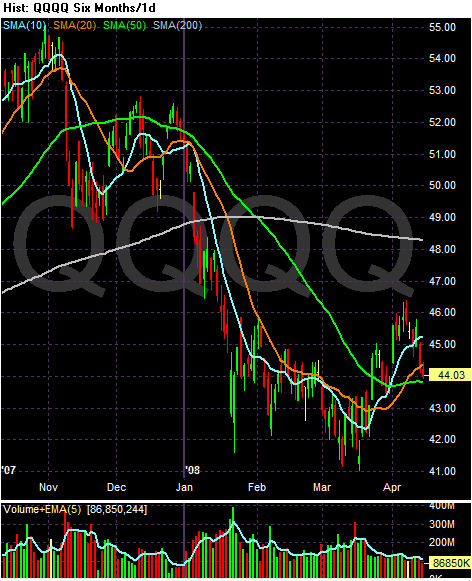
On the SMA chart, notice that

-- Prices are about 8.7% below the 200 day SMA

-- The 10 and 20 day SMA are moving higher,

-- The 10 and 20 day SMA have moved through the 50 day SMA, but

-- Prices are below the 10 and 20 day SMA which will pull them lower


-- Prices are about 9.8% below the 200 day SMA

-- Broadly speaking, prices are between 64 and 73,

-- But prices and the SMAs are bunched together giving little indication in either direction.

Retail Sales -- Thank God for Inflation

From Thompson Financial:

The Commerce Department reported Monday that retail sales edged up 0.2 percent in March after a 0.4 percent decline in February. The March gain primarily reflected higher costs for gasoline, which climbed to record highs. Excluding a big 1.1 percent rise in sales at gasoline service stations, retail sales would have been flat last month.


So -- without this:


There would be no gain. That's really comforting.

This really isn't that complicated.


Declining employment


Leads to lower income


Leads to declining sentiment


And declining confidence


Leads to lower outlays

More importantly, look at this chart of real (inflation adjusted) retail sales from the St. Louis Federal Reserve


Sales have been flat for about two years.


And the year over year chart is not negative -- which is definitely not good.

More Reasons For Spiking Food Prices

From the WSJ:

For all the economists and consumers who hope high food prices are temporary, here's one reason why they probably won't be: Farm costs are skyrocketing, making permanently higher prices essential for farmers to keep expanding production.

Inflation is biting farmers world-wide. In New Zealand, farm wages are up as much as 20% this year, and the average price of a dairy cow has jumped to more than $1,900 -- almost double last year's average of about $1,000. In Thailand and Indonesia, farmers are complaining about sharp increases in the price of fertilizer and diesel fuel.


In the American Midwest, land prices have jumped, along with the cost of energy and chemicals. The price of diammonium phosphate, a common fertilizer, is about $1,200 a ton in the U.S., up from about $450 a ton a year ago.

"Diesel, fertilizer, insecticide, grass-killing chemicals, they're all going up -- just like a shadow," says Samear Ruengrit, a 57-year-old farmer who grows rice about 45 minutes north of Bangkok. His average costs are now about 50% higher than last season, he says.

Farming costs are climbing for several reasons. Higher fuel prices make it more expensive to run tractors and other equipment, while pricier natural gas -- needed to make some fertilizers -- has also played a role. Equipment prices are rising because of strong demand for farm machinery in China and other developing countries, along with rising costs for raw materials like steel.

Wages are up in some parts of the world because many farms are expanding to meet higher demand, putting pressure on labor supplies, especially in countries like Australia where many workers are already occupied in commodity-based trades like mining.

Cost pressures have intensified over the past six months. Many farm suppliers and equipment dealers held back on price increases in 2006 and 2007, despite their own higher energy and labor costs. Now, after a year or more of strong markets for corn and other crops, those suppliers are deciding farmers can afford to pay more -- and they are passing costs along.


OK -- let's add a bit more depth to some of these points. Also remember -- I'm a city boy; I don't know nothin' 'bout no farmin'."

First, let's look at some charts of raw material prices:


Natural gas prices have two periods with the possibility of a third emerging. The first period occurred in the 1990s with prices fluctuating between 1.5 and 3.5 (roughly). Prices spiked out of this range once in 2001 - 2002. The second period occurred between occurred between 2003 and early 2008 with prices ranging from 5.25/5.50 to 8.25/8.50 or so. Prices have advanced from this range since the start of 2008. However, prices also spiked in 2001 - 2002 and late 2005 and returned to the previously mentioned range, so we'll have to wait and see how this plays out.


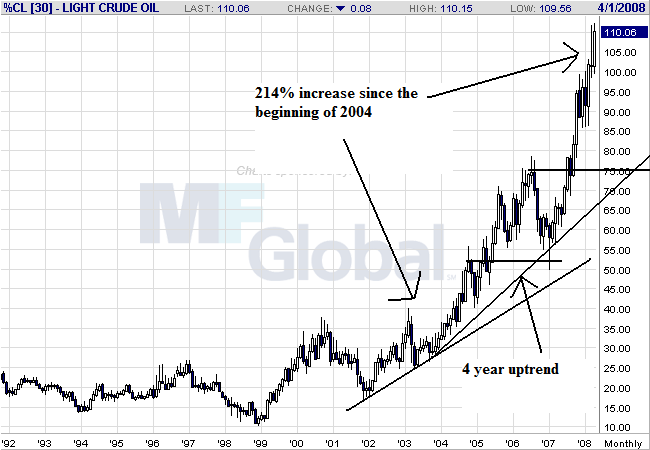
Oil has rallied since the beginning of 2002 and has risen since 214% since the beginning of 2004. It has continually broken through previous resistance to set new highs.

Let's look at some corporate earnings, courtesy of Morningstar.com

Here is Cat's 10-year earning history:


Although Cat has not been the best performing stock:


And here is John Deere's earnings:


It's chart is far more impressive:


And the fertilizer field is literally on fire right now.

Here is a chart of Mosaic's earnings from Morningstar:


And Mosaics chart -- which is also very impressive:


Monsanto's earnings have a solid upward trend:


As does it's chart:


Potash -- which has been a hot company chart wise -- has a good earnings record but they have dipped:


But the chart is on solid:


Bottom line -- the companies that supply raw materials, physical capital and other materials to the agricultural industry are doing very well right now.

Earnings Season Doesn't Start Well

From the AP

Alcoa, the world's third-largest aluminum producer, said Monday it earned $303 million, or 37 cents per share, for the first three months of the year, compared with $662 million, or 75 cents per share, during the same period last year.

Sales fell nearly 7 percent to $7.38 billion, from $7.91 billion a year earlier.

Excluding the impact of restructuring and taxes, operating income was 44 cents per share, down from 79 cents per share a year ago. The weaker dollar reduced profits by $68 million, or 8 cents per share, on a quarter-by-quarter basis.

The results failed to meet some Wall Street expectations. Analysts surveyed by Thomson Financial, on average, forecast earnings of 48 cents per share on revenue of $7.18 billion.

Alcoa shares fell 26 cents to close at $37.18 Tuesday.


According to Yahoo Finance Alcoa is the largest company in the aluminum sector by far; it's market cap is $28.6 billion with he next largest company at $5.4 billion.

From Barron's citing a CSFB report (Wednesday April 9):

UPS ANNOUNCED THAT IT HAS reduced its first-quarter earnings-per-share guidance from 94 cents-98 cents to 86 cents-87 cents (compared with our estimate of 92 cents and consensus of 93 cents).

The company cited higher-than-expected fuel costs and soft demand at its U.S. package division as the primary reasons for the earnings shortfall (which management indicated could happen at their March investor day). The company noted that the economy worsened during the quarter which led to a "significant reduction" in package volumes and a trade down from premium price (Next Day) to lower-yielding products (Deferred).

In light of the announcement, we have lowered our first-quarter and fiscal 2008 EPS estimates from 92 cents and $4.40, respectively, to 86 cents and $4.00. We have also reduced our fiscal 2009 EPS forecast by 30 cents to $4.65 as the economic outlook remains highly uncertain.


According to Yahoo Finance, UPS is the largest air deliver and freight company, with a market cap of $73.3 billion. The next largest company is FedEx with a market cap of $28.8 billion.

From Marketwatch:

General Electric Co. shook the U.S. stock market Friday, reporting a 6% drop in first-quarter net profit -- largely over trouble in its financial-services businesses -- and cutting its 2008 earnings outlook.

It was GE's first major downward earnings revision in memory, Oppenheimer analyst Christopher Glynn said in a note, and reflected mounting difficulties posed by a weakened U.S. economy.

For the first quarter, General Electric said net income dropped to $4.3 billion, or 43 cents a share, from profit generated during the first quarter of 2007, while revenue rose 8% to $42.24 billion.


GE is one of the largest companies in the world and is a member of the DJIA.

So -- what's the point of all these stories?

All of these stocks are bell weather companies -- they are the largest company in their sector by far. As such, they are more likely to be doing well in a downturn -- or at least not as badly as you would think. However, they are not doing well which means other, smaller, less established companies stand a smaller chance of doing well.

Also -- expect there to be more spin associated with these numbers. For example -- expect to hear "outside of financial stocks, everything is fine." Unfortunately there is going to be more and more of that now.

Sunday, April 13, 2008

Expecting More Bad Inflation News

Next week we get CPI and PPI. I have little hope these numbers will be anything but terrible for a few reasons.

First, last week's import price number was terrible.

The U.S. Import Price Index increased 2.8 percent in March, the Bureau of Labor Statistics of the U.S. Department of Labor reported today, as higher prices for both petroleum and nonpetroleum imports contributed to the advance. The rise followed 0.2 percent and 1.5 percent increases in February and January. Export prices rose 1.5 percent in March, after advancing 1.1 percent and 1.2 percent for the
prior two months.

The price index for overall imports rose 2.8 percent in March, led by a 9.1 percent advance in petroleum prices. Petroleum prices resumed an upward trend following a 1.9 percent downturn in February. Prices for petroleum rose 60.0 percent for the year ended in March following a comparatively modest 3.1 percent rise over the previous 12-month period. A 1.1 percent increase in nonpetroleum prices also contributed to the overall rise and was the largest one-month increase for the index since nonpetroleum prices were first published on a monthly basis in December 1988. The price indexes for overall imports and nonpetroleum imports also advanced for the March 2007-08 period,increasing 14.8 percent and 5.4 percent, respectively.


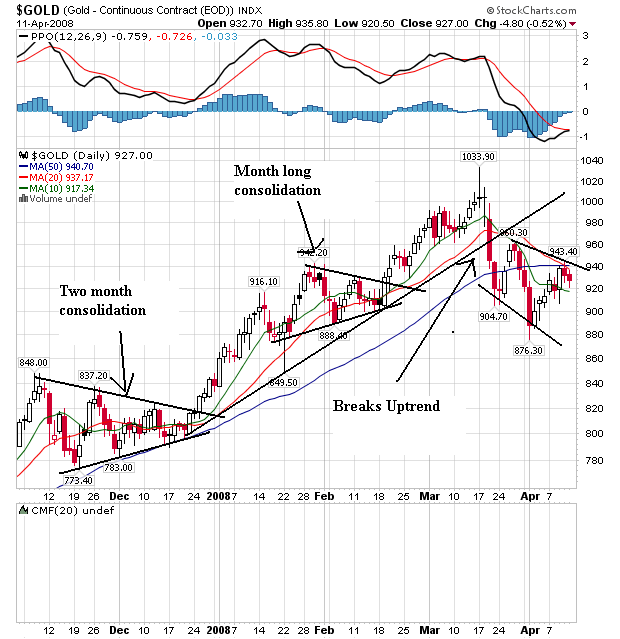
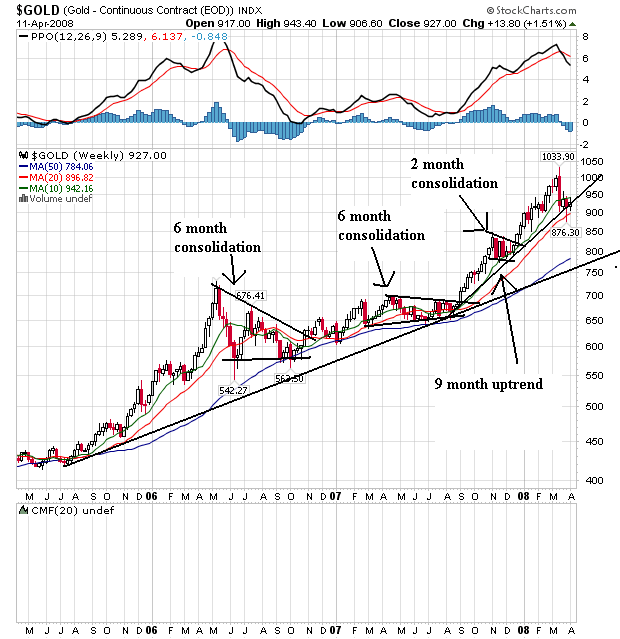
Inflation expectations are far from grounded, as represented by gold:


The market has been rising for about three years. It has continually moved higher, consolidated and continued its upward move. Also notice how it has used the 10, 20 and 50 SMA for support at various times.


On the daily chart notice the following:

-- Prices recently broke a two month uptrend

-- Prices are moving in a downward channel

-- The 10 and 20 SMA crossed below the 50 day SMA

-- Prices just bounced off the 50 day SMA

This chart could indicate that traders are backing off gold for now. But put this chart in context with the longer term chart above. We'd need to see a lot more technical damage before we could say expectations had reversed.

But most importantly, we're seeing food riots across the globe and requests for help:

The president of the World Bank on Sunday urged immediate action to deal with mounting food prices that have caused hunger and deadly violence in several countries.

Robert Zoellick said the international community has "to put our money where our mouth is" and act now to help hungry people. "It is as stark as that."

He called on governments to rapidly carry out commitments to provide the U.N. World Food Program with $500 million in emergency aid it needs by May 1.

"It is critical that governments confirm their commitments as soon as possible and others begin to commit," Zoellick said. Prices have only risen further since the WFP issued that appeal, so it is urgent that governments step up, he said.


Clearly there are shortages in a lot of places right now. Shortages usually have a way of spiking prices further.

Also see this article from the front page of today's WSJ:

Finance ministers gathered this weekend to grapple with the global financial crisis also struggled with a problem that has plagued the world periodically since before the time of the Pharaohs: food shortages.

Surging commodity prices have pushed up global food prices 83% in the past three years, according to the World Bank -- putting huge stress on some of the world's poorest nations. Even as the ministers met, Haiti's Prime Minister Jacques Edouard Alexis was resigning after a week in which that tiny country's capital was racked by rioting over higher prices for staples like rice and beans.

As food prices soar, protests are breaking out around the world, including this riot Saturday in Port-au-Prince, Haiti.

Rioting in response to soaring food prices recently has broken out in Egypt, Cameroon, Ivory Coast, Senegal and Ethiopia. In Pakistan and Thailand, army troops have been deployed to deter food theft from fields and warehouses. World Bank President Robert Zoellick warned in a recent speech that 33 countries are at risk of social upheaval because of rising food prices. Those could include Indonesia, Yemen, Ghana, Uzbekistan and the Philippines. In countries where buying food requires half to three-quarters of a poor person's income, "there is no margin for survival," he said.


Also see this post from last week.