Showing posts with label foreclosures. Show all posts

Thursday, August 12, 2010

July foreclosures down nearly 10% from last year

- by New Deal democrat

Atrios this morning says that "The forgotten foreclosure crisis [ ] keeps getting worse."

Ummm, no. Yes, foreclosures do constitute a huge problem, and yes I agree that cramdown legislation would be a boon to the economy, but to the contrary, it seems we can stick a fork in the notion that there was going to be a massive second round of foreclosures due to 2005 vintage mortgage re-amortizations coming due:

RealtyTrac reported that on a YoY basis:
filings declined ... nearly 10% [ ] in July. There were 325,229 properties that received a foreclosure filing in July, a 4% increase from May. It also marks the 17th consecutive month that foreclosure activity exceeded 300,000, said James Saccacio, CEO of RealtyTrac.

Saccacio added that default notices were down from the previous year for the sixth straight month in July as servicers and lenders have escalated repossessions (REOs) to near-record levels.

In July 97,123 properties received a default notice, a 28% decrease from July 2009 but a 1% increase from the previous month. Default notices are down 32% from the 142,064 peak in April 2009.
Here is the updated chart of year over year changes in foreclsoure activity for the last 16 months:

MonthYoY % changeactual foreclosures
04/2009+32 342,038
05/2009+18 321,480
06/2009+33 336,173
07/2009+32 360,149
08/2009+18 358,471
09/2009+29 343,638
10/2009+19332,292
11/2009+22 306,627
12/2009+15 349,519
01/2010+15 315,716
02/2010+6 308,524
03/2010+8 367,056
04/2010-2 333,837
05/2010+1322,920
06/2010-7313,841
07/2010-10 325,229


The trend in those numbers is definitely not "getting worse."

Next month (August) marks the peak of when mortgage re-amortizations come due. If the fabled "tsunami" doesn't appear then, we can safely call it a blown prediction, although there may yet be an echo-foreclosure increase due to renewed house prices declines in the next couple of years. Probably this is what RealtyTrac's spokesman, Rick Sharga, is refering to when he states his belief that foreclosure activity probably won't peak until next year.

Thursday, July 15, 2010

The Foreclosure Wave appears to have crested

- by New Deal democrat

Long long ago and far far away on a foreign-flagged vessel outside the territorial limits of US waters, as I was sitting next to William F. Buckley, Jr., sharing a mind-altering substance and observing the behavior of the parents and children around us, I had the profound if alienating insight that "They think they're so different. But they're really just apes."

Sometimes it helps to think of people as just feindishly smart, nimble, and clever chimpanzees -- and worse, chimpanzees who share their clever shortcuts with every other chimpanzee on the savannah. Give them a seemingly insurmountable obstacle and they will nevertheless find some cunning way around it.

Save that thought as we examine latest from RealtyTrac, which released its midyear report this morning.

According to Realty Trac:

a total of 1,961,894 foreclosure filings ... were reported ... in the first six months of 2010, a 5 percent decrease in total properties from the previous six months but an 8 percent increase in total properties from the first six months of 2009. The report also shows that 1.28 percent of all U.S. housing units (one in 78) received at least one foreclosure filing in the first half of the year.
....

Foreclosure filings were reported on 895,521 U.S. properties during the second quarter, a decrease of nearly 4 percent from the previous quarter and an increase of less than 1 percent from the second quarter of 2009. Default and auction notices were down on a quarter-over-quarter and year-over-year basis in the second quarter, but bank repossessions (REOs) increased 5 percent from the previous quarter and 38 percent from Q2 2009 to 269,962 — a new quarterly high for the report.

“The second quarter was a tale of two trends,” said James J. Saccacio, chief executive officer of RealtyTrac. “The pace of properties entering foreclosure slowed as lenders pre-empted or delayed foreclosure proceedings on delinquent properties with more aggressive short sale and loan modification initiatives. Meanwhile the pace of properties completing the foreclosure process through bank repossession quickened as lenders cleared out a backlog of distressed inventory delayed by foreclosure prevention efforts in 2009.
In summary, old foreclosures were being completed at a very high rate, while new foreclosures were slowing down.

Readers may recall that three months ago I had a brief debate with another blogger who viewed the March increase in foreclosures over February as the beginning of a new "tsunami." The genesis of this story goes back to this graph and others like it that made the rounds beginning in 2006:
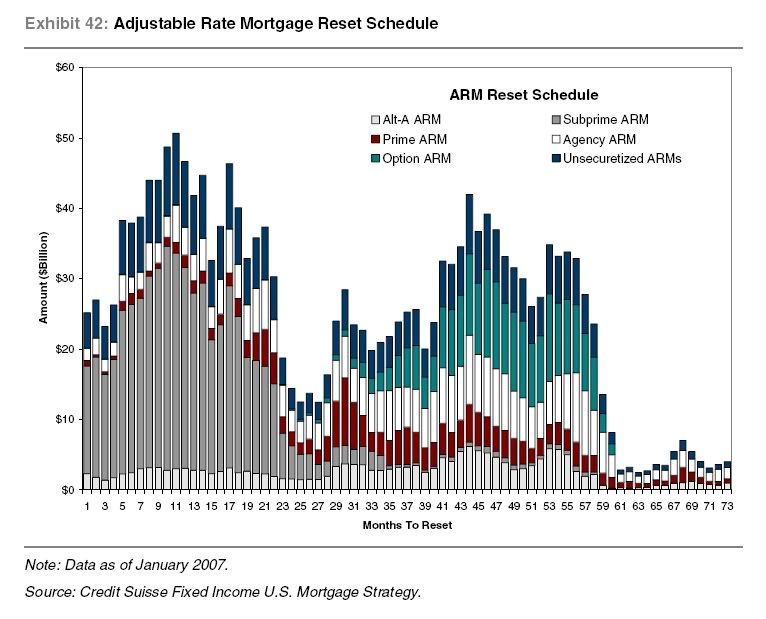
showing that mortgage recasts and resets were coming in two waves: the first in 2007-08, and the second this year and 2011. If foreclosures had followed the pattern of this graph, the YoY rate should have bottomed in about last November (month 35) and have been skyrocketing again since.


As I have previously stated, I always been a little chary of that notion, because, by 2008 and certainly 2009, a lot of those homeowners (who were already probably deeply underwater), let their houses go into foreclosure, or else worked out a refinancing. Thus in my exchange with the other blogger, I countered that the data actually was more consistent with the crest of the foreclosure wave than the beginning of a new one.

Three months later, it looks like we have our answer. Here is the updated chart of year over year changes in foreclsoure activity for the last 15 months:

MonthYoY % changeactual foreclosures
04/2009+32 342,038
05/2009+18 321,480
06/2009+33 336,173
07/2009+32 360,149
08/2009+18 358,471
09/2009+29 343,638
10/2009+19332,292
11/2009+22 306,627
12/2009+15 349,519
01/2010+15 315,716
02/2010+6 308,524
03/2010+8 367,056
04/2010-2 333,837
05/2010+1322,920
06/2010-7313,841

We are now only two months before the absolute peak of the second set of resets on the graph above. If any new tsunami was going to develop, it certainly ought to be noticeable by then.


Last month I speculated that it is also possible that a second hump in foreclosures, probably a small echo of the first, could occur not because of resets but because of further price declines, now that the $8000 home buyers' credit has ended. It turns out there is a counterargument to that, and the counterargument may already be in evidence, in this graph of Chapter 13 bankruptcies (h/t Calculated Risk):
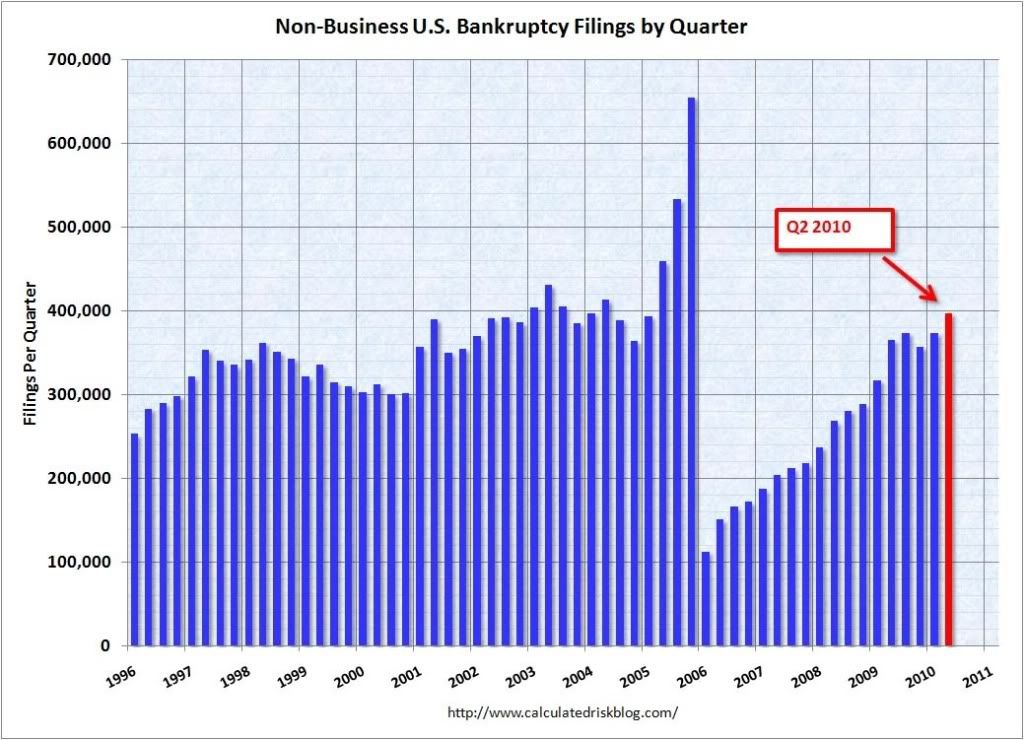

Citing the NY Post, CR argued:


Underwater homeowners are jumping onto an unexpected financial life raft that lets them escape crippling second mortgage debts and keep their homes -- Chapter 13 bankruptcy.
...
How it works is this: If the home is appraised at less than the value of the first mortgage, the owner can apply for permission in bankruptcy court to reclassify the second mortgage debt. That changes it from a secured debt, which must be repaid, into an unsecured debt, which does not have to be paid in full. The homeowner can then focus on paying off the first mortgage.
For many borrowers, this makes a Chapter 13 bankruptcy a better choice than a foreclosure. With a foreclosure, the borrower loses the house - and the 2nd lien holder might still pursue the borrower (unless they release the lien for some compensation, like under HAFA).

With a bankruptcy - under certain circumstances - the borrower keeps the house, and the 2nd lien is converted to unsecured debt and does not have to be paid in full. This is probably part of the reason for sharp increase in bankruptcy filings.

In other words: D#*@ed clever chimpanzees!

Thursday, June 10, 2010

More evidence the Foreclosure Wave is Cresting

- by New Deal democrat

Two months ago I had a brief debate with another blogger who viewed the March increase in foreclosures over February as the beginning of a new "tsunami." The genesis of this "second wave" story goes back to stories that started making the rounds in late 2006 noting that mortgage recasts and resets were due to hit in two waves: the first in 2007-08, and the second this year and 2011.

I have always been a little chary of that notion, because, while in 2006 lots of people were still deluding themselves that "real estate only goes up!" by 2008 and certainly 2009, they had been disabused of that notion. Thus, a lot of those homeowners, who were probably deeply underwater, already let their houses go into foreclosure, or else worked out a refinancing before now. Thus in my exchange with the other blogger, I countered that the data actually was more consistent with the crest of the foreclosure wave than the beginning of a new one, but that it could also be consistent with there being a lull during the "eye of the hurricane," and that,
if there is a new wave, or a "back side of the hurricane", then the percentages and the raw numbers of foreclosures ought to start increasing quickly. If, on the other hand, the 2nd derivative continues to be negative, then we ought to see foreclosures tip over into YoY negative percentages in the next few months, or certainly by the end of the year.
Sure enough, in April, foreclosures decreased 9% from March and 2% from April 2009.

This morning Realty Trac" released their May report:
There were 322,920 properties that received a foreclosure filing in May, down 3% from 333,837 in April. But it remains 1% above levels seen in May 2009....

James Saccacio, CEO of RealtyTrac, added lenders are not making as many new filings and are instead focusing on the backlog of distressed properties built up over the past 20 months, a continued trend from April....

“Lenders appear to be ramping up the pace of completing those forestalled foreclosures even while the inflow of delinquencies into the foreclosure process has slowed,” Saccacio said
Here is the updated chart of year over year changes in foreclsoure activity for the last 14 months:

MonthYoY % changeactual foreclosures
04/2009+32 342,038
05/2009+18 321,480
06/2009+33 336,173
07/2009+32 360,149
08/2009+18 358,471
09/2009+29 343,638
10/2009+19332,292
11/2009+22 306,627
12/2009+15 349,519
01/2010+15 315,716
02/2010+6 308,524
03/2010+8 367,056
04/2010-2 333,837
05/2010+1322,920

So far, this certainly looks more like the cresting of a wave than the beginning of a new one, but I'd still like to see another month or two of data to be sure that the spring 2010 resets haven't impacted the YoY numbers, due to their lagging nature.

It's also possible that a second hump in foreclosures, probably a small echo of the first, could occur not because of resets but because of further price declines, now that the $8000 home buyers' credit has ended. If so, I would expect that to show up later this year or early next year for reasons that go beyond the scope of this post. (Way back in 2006 I was able to call the turn in the housing market in real time, due to a web site that posted really good and timely weekly data on about 40 housing markets. That same web site still exists and appears to be giving clues as to when housing prices might bottom. But that is another, long, post).

Thursday, May 13, 2010

About that Foreclosure Tsunami: Not So Much?

- by New Deal democrat

Last month I wrote about having a little debate with another blogger who viewed the March increase in foreclosures over February as the beginning of a new "tsunami." I countered that the data actually was more consistent with the crest of the foreclosure wave than the beginning of a new one, but that it could also be consistent with there being a lull during the "eye of the hurricane," and that,
if there is a new wave, or a "back side of the hurricane", then the percentages and the raw numbers of foreclosures ought to start increasing quickly. If, on the other hand, the 2nd derivative continues to be negative, then we ought to see foreclosures tip over into YoY negative percentages in the next few months, or certainly by the end of the year.
Well, this morning Realty Trac reported that April foreclosures
show[ed] that foreclosure filings — default notices, scheduled auctions and bank repossessions — were reported on 333,837 properties in April, a 9 percent decrease from the previous month and a 2 percent decrease from April 2009....

“There were two important milestones in the April numbers that show foreclosure activity has begun to plateau — but at a very high level that will not drop off in the near future,” said James J. Saccacio, chief executive officer of RealtyTrac.
So, here is the updated chart of year over year changes in foreclsoure activity for the last 13 months:

MonthYoY % changeactual foreclosures
04/2009+32 342,038
05/2009+18 321,480
06/2009+33 336,173
07/2009+32 360,149
08/2009+18 358,471
09/2009+29 343,638
10/2009+19332,292
11/2009+22 306,627
12/2009+15 349,519
01/2010+15 315,716
02/2010+6 308,524
03/2010+8 367,056
04/2010-2 333,837

That certainly looks more like the cresting of a wave than the beginning of a new one.

The genesis of the "second wave" story goes back to stories that started making the rounds in late 2006 noting that mortgage recasts and resets were due to hit in two waves: the first in 2007-08, and the second this year and 2011. I have always been a little chary of that notion, because, while in 2006 lots of people were still deluding themselves that "real estate only goes up!" by 2008 and certainly 2009, they had been disabused of that notion. Thus, a lot of those homeowners, who were probably deeply underwater, already let their houses go into foreclosure, or else worked out a refinancing before now.

With the April data, that scenario is looking more correct. Still, I'm not ready to declare the notion of a second foreclosure tsunami dead yet, because of the lagging nature of YoY data. But another 2 or 3 months like this and it may be "pining for the fjords" ....

Wednesday, April 21, 2010

Foreclosures: New wave or Crest (and is it bad or good)?

- by New Deal democrat

I got into a little debate with another blogger who viewed the March increase in foreclosures over February as the beginning of a new "tsunami." You can read his diary here if you wish. Mish also breathlessly reported that:
Foreclosure activity of all types spiked in the first quarter of 2010 according to RealtyTrac. Activity is now at an all time record of 932,234 properties.
[N.B.: Mish has been a reliable contrary indicator for the last year, unintentionally telegraphing turning points in data. Keep in mind below his contention that foreclosures "spiked" in the first quarter.]

In any event, I went back and dug out prior Realty Trac press releases, which suggest the new tsunami ain't necessarily so. I thought I'd share that data here, since it is worth tracking over the remainder of the year.

The genesis of this story goes back to this graph and others like it that made the rounds beginning in 2006:

showing that mortgage recasts and resets were coming in two waves: the first in 2007-08, and the second this year and 2011.

While we certainly have had a tremendous numbers of foreclosures, I have always been a little chary of the notion that the 2010-11 "back end of the hurricane" as Russ Winter once called it, was going to be nearly as big as advertised. That's because, while in 2006 lots of people were still deluding themselves that "real estate only goes up!" by 2008 and certainly 2009, they had been disabused of that notion. Thus, I expect that a lot of those homeowners, who are probably deeply underwater, already let their houses go into foreclosure, or else worked out a refinancing before now.

So, here are the year over year changes as measured in the last 12 months:


MonthYoY % changeactual foreclosures
04/2009+32 342,038
05/2009+18 321,480
06/2009+33 336,173
07/2009+32 360,149
08/2009+18 358,471
09/2009+29 343,638
10/2009+19332,292
11/2009+22 306,627
12/2009+15 349,519
01/2010+15 315,716
02/2010+6 308,524
03/2010+8 367,056

Did anybody see that "spike" that Mish claimed happened in the first quarter? I don't think so. Note that my interlocutor said that the decline in percentage increases should be dismissed, because the actual numbers involved were so large. That doesn't appear to be the case either. So, contrary to March's increase being the beginning of a second wave, it seems more likely that this is the crest of the foreclosure wave

To be fair, though, our data up until now could be consistent with there being a lull during the "eye of the hurricane" in the graph above (that would have taken place early last year, so would be showing up in the last 5-12 months). If there is a new wave, or a "back side of the hurricane", then the percentages and the raw numbers of foreclosures ought to start increasing quickly. If, on the other hand, the 2nd derivative continues to be negative, then we ought to see foreclosures tip over into YoY negative percentages in the next few months, or certainly by the end of the year.

Of course, some people think that part of the increase we are seeing in retail sales (see my post below) is due to underwater homeowners "strategically defaulting" on their mortgage. If so, it is entirely possible that, on balance, an increase in foreclosures might be a net positive for the economy, as it means house prices aligning more closely with wages, and disposable consumer income increases. I happen to know of one young person who is doing exactly that after his bank refused to renegotiate his mortgage rate from 7% to 5%, on the grounds that he was a "poor risk" for the mortgage amount (Funny, the bank doesn't seem to feel that way about the mortgage at 7%).

In any event, I will update this graph from time to time. We ought to have a decent preliminary answer within the next 3 to 6 months.