I got into a little debate with another blogger who viewed the March increase in foreclosures over February as the beginning of a new "tsunami." You can read his diary here if you wish. Mish also breathlessly reported that:
Foreclosure activity of all types spiked in the first quarter of 2010 according to RealtyTrac. Activity is now at an all time record of 932,234 properties.[N.B.: Mish has been a reliable contrary indicator for the last year, unintentionally telegraphing turning points in data. Keep in mind below his contention that foreclosures "spiked" in the first quarter.]
In any event, I went back and dug out prior Realty Trac press releases, which suggest the new tsunami ain't necessarily so. I thought I'd share that data here, since it is worth tracking over the remainder of the year.
The genesis of this story goes back to this graph and others like it that made the rounds beginning in 2006:
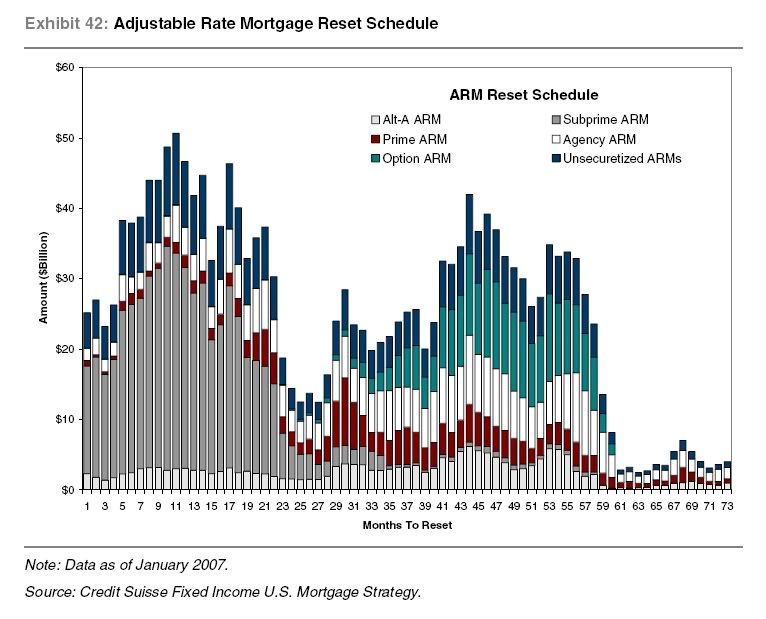
showing that mortgage recasts and resets were coming in two waves: the first in 2007-08, and the second this year and 2011.
While we certainly have had a tremendous numbers of foreclosures, I have always been a little chary of the notion that the 2010-11 "back end of the hurricane" as Russ Winter once called it, was going to be nearly as big as advertised. That's because, while in 2006 lots of people were still deluding themselves that "real estate only goes up!" by 2008 and certainly 2009, they had been disabused of that notion. Thus, I expect that a lot of those homeowners, who are probably deeply underwater, already let their houses go into foreclosure, or else worked out a refinancing before now.
So, here are the year over year changes as measured in the last 12 months:
| Month | YoY % change | actual foreclosures |
|---|---|---|
| 04/2009 | +32 | 342,038 |
| 05/2009 | +18 | 321,480 |
| 06/2009 | +33 | 336,173 |
| 07/2009 | +32 | 360,149 |
| 08/2009 | +18 | 358,471 |
| 09/2009 | +29 | 343,638 |
| 10/2009 | +19 | 332,292 |
| 11/2009 | +22 | 306,627 |
| 12/2009 | +15 | 349,519 |
| 01/2010 | +15 | 315,716 |
| 02/2010 | +6 | 308,524 |
| 03/2010 | +8 | 367,056 |
Did anybody see that "spike" that Mish claimed happened in the first quarter? I don't think so. Note that my interlocutor said that the decline in percentage increases should be dismissed, because the actual numbers involved were so large. That doesn't appear to be the case either. So, contrary to March's increase being the beginning of a second wave, it seems more likely that this is the crest of the foreclosure wave
To be fair, though, our data up until now could be consistent with there being a lull during the "eye of the hurricane" in the graph above (that would have taken place early last year, so would be showing up in the last 5-12 months). If there is a new wave, or a "back side of the hurricane", then the percentages and the raw numbers of foreclosures ought to start increasing quickly. If, on the other hand, the 2nd derivative continues to be negative, then we ought to see foreclosures tip over into YoY negative percentages in the next few months, or certainly by the end of the year.
Of course, some people think that part of the increase we are seeing in retail sales (see my post below) is due to underwater homeowners "strategically defaulting" on their mortgage. If so, it is entirely possible that, on balance, an increase in foreclosures might be a net positive for the economy, as it means house prices aligning more closely with wages, and disposable consumer income increases. I happen to know of one young person who is doing exactly that after his bank refused to renegotiate his mortgage rate from 7% to 5%, on the grounds that he was a "poor risk" for the mortgage amount (Funny, the bank doesn't seem to feel that way about the mortgage at 7%).
In any event, I will update this graph from time to time. We ought to have a decent preliminary answer within the next 3 to 6 months.