- by New Deal democrat
No big economic news today, so I wanted to follow up on Monday’s post, in which I described the correlation between the number of new COVID cases and States in which there were high vaccination rates vs. ones with low rates.
The both sad and maddening point is, vaccination rates correlate strongly with partisan lean, and so do the present level of COVID cases.
First, here is a graph of vaccination rates by partisan lean (via the NYT):
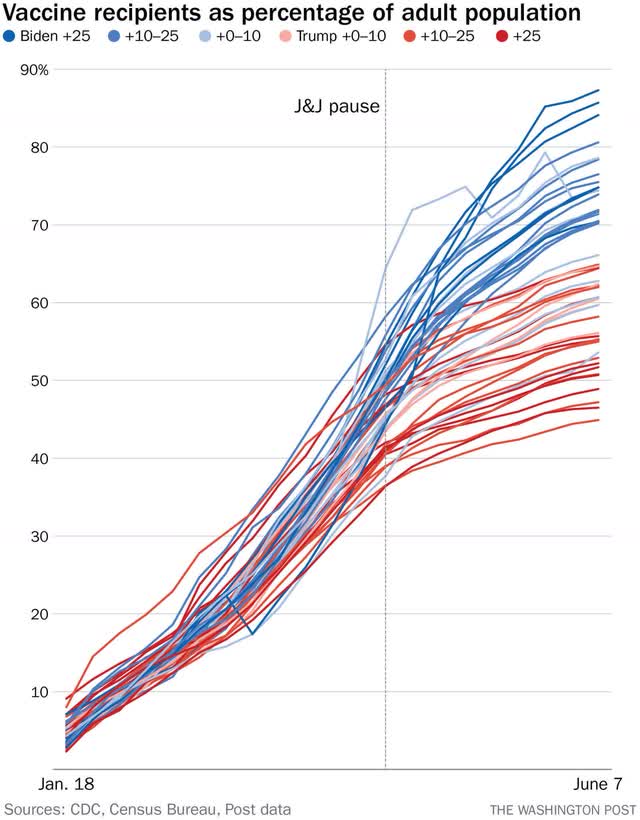
This is pretty compelling: States with strong Democratic leans almost all have higher vaccination rates than almost all States with GOP leans.
Now let’s break out new infection levels.
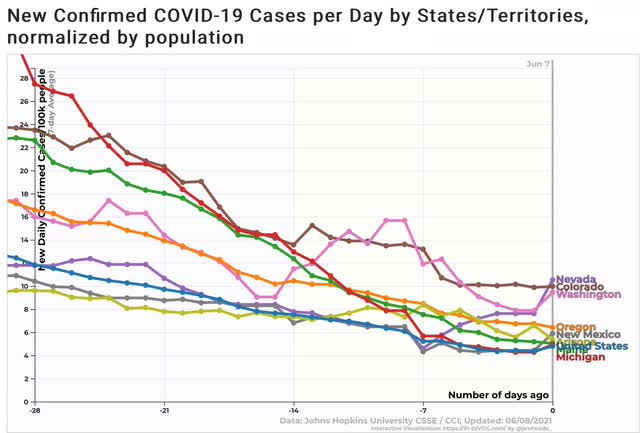
First, here are those States which Biden won but which have higher rates of new infections than the US average (as of this morning, Pennsylvania is no longer one of them):
And now here are the States that Trump won that high higher rates of new infections:
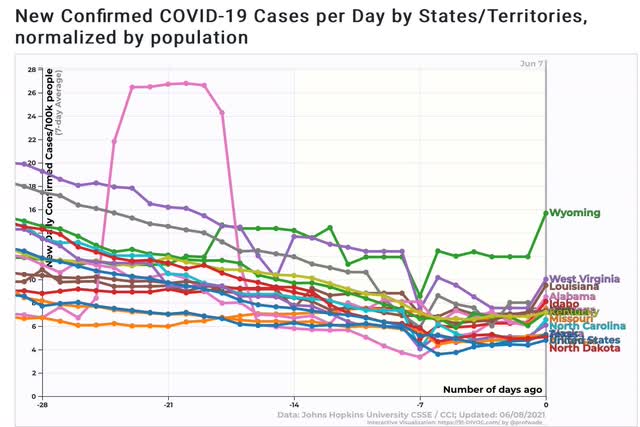
As you can see, there are only 8 States that Biden won that have above-average new infections, and all but 2 are under 8 per 100,000. On the other hand, there are 15 States that Trump carried that have above-average new infections, and 5 of them are above 8 per 100,000.
Now, here are the States that Biden won that have below-average rates of new infections:
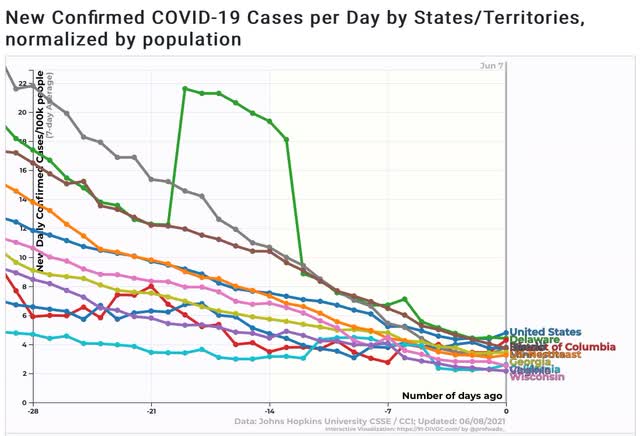
Including the entire US Northeast, these amount to 18 States plus the District of Columbia.
Here are the States that Trump won with below-average rates of new infections:
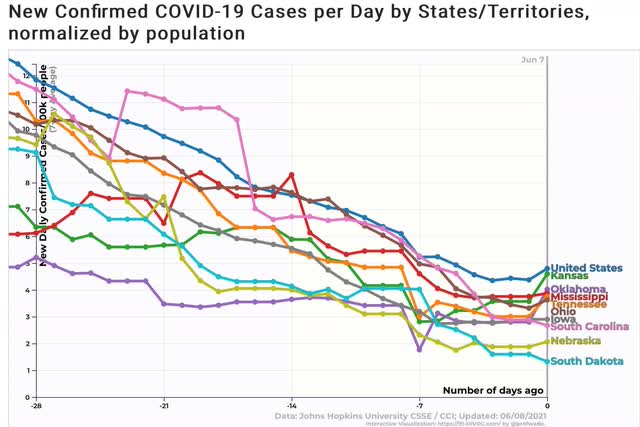
There are only 9 of these.
The simple fact is, while the correlation isn’t perfect, it’s clear that States that Biden won have significantly higher rates of vaccinations, and significantly fewer new cases of COVID. And by and large, the Biden-won States are showing continued declines, while many of the Trump-won States are only showing slight declines, and in a few cases no declines at all.