- by New Deal democrat
Here is the update through yesterday (April 9). Real life intrudes a little, so I have omitted the State by State analysis, and abbreviated the conclusions.
I’ve changed the format, moving the “just the facts, ma’am” data to the top, and comments to the end. Significant new developments are indicated in italics.
The four most important metrics are starred (***) below.
Number and rate of increase of Reported Infections (from Johns Hopkins via arcgis.com)
- Number: up +33,958 to 466,636 (vs. 33,787 prior peak on April 4)
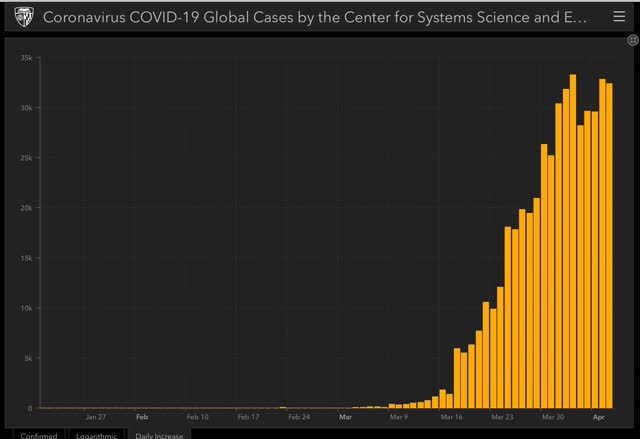
- ***Rate of increase: day/day: 8% (vs. 10% for the past week, and 8% on April 8)
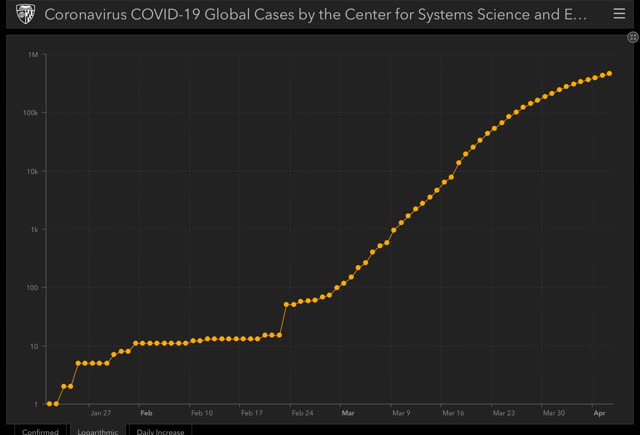
The exponential growth rate began to fall from 35% on March 24. In the past two weeks it was in a slowly decelerating trend of between -0.5% and -1%/day. In the past 4 days that has nearly come to a halt.
Nevertheless, State lockdowns have been working.
Ben Engebreth is tracking coronvirus infection and testing numbers for each State, with graphs, here. Also, there is an awesome interactive tool to measure infections and other data for various countries and US States at 91-divoc.com.
Number of deaths and infections and rate of increase of testing (from COVID Tracking Project)
- ***Number of deaths: Total 16,399, up +1,904 day/day
- Rate: increase of 13% day/day vs. average of 14% in past week
- Number of tests: 162,769 up +21,460 day/day, new daily high for non-“pending” tests
- Rate: increase +15% vs. number of tests previous day
- Tests pending result: 17,631 vs. 17,228 on April 8 day/day
Comparison of rates of increase in documented infections vs. testing
- Infections +8% vs. Tests +15% day/day
Result: The rate of testing appeared to be catching up a little bit to the spread of the virus, but stalled again in the past week at about 140,000/day. Even with yesterday’s 20,000+ increase, it remains far below what is needed, which is probably now at least 250,000/day, and is falling further behind.
Ratio of tests to positives for infection (from COVID Tracking Project)
- Number: 162,769 new tests vs. 34,326 new diagnosed infections
- ***Ratio: 4.7:1
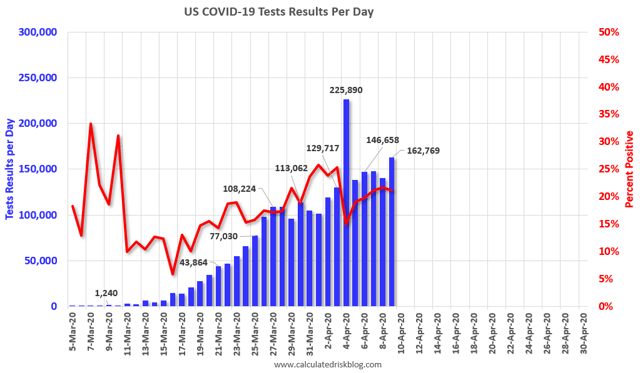
In South Korea, where aggressive testing has led to a near-total disappearance of new cases, the inflection point where the number of new daily cases plateaued was reached when the ratio of tests to new cases found reached 15:1. Any ratio less than that suggests that not enough testing is being done. Yesterday’s ratio of 4.7:1 is not only far behind, but has gotten worse in the past 4 days. I am very concerned that we face a situation similar to what we had a month ago, where insufficient testing was hiding the spread of the virus. That the percentage of positive results to total tests keeps rising only heightens that concern — i.e., we are not looking for new potential breakouts. Yesterday’s pattern - where an increase in testing of 14% led to an increase positive diagnoses of 12% , only reinforces that position.
Summary for April 10
There are 3 items of significance that happened in the past day:
- The number of new diagnoses made a new high, superseding the recent April 4 high
- A 15% increase in testing, to a new high ex-“pending” results, netted a 12% increase in new diagnoses. In other words, about all the increase in testing did was show how many new infections we have been missing.
- Trump was forced to backtrack on ending funding for community test centers, but again put forward an early end to lockdowns (which the federal government does not have the power to force on the States anyway) which, if implemented, would only result in renewed exponential spread.