- by New Deal democrat
Here is the update through yesterday (May 9).
As usual, significant developments are in italics.
I have discontinued giving the % increases day/day in infections and deaths. I will restart them if infections in States that have “reopened” start to increase significantly again. The preliminary, anecdotal evidence is that customers are largely staying away from reopened businesses in those States.
Number of new and total reported Infections (from Johns Hopkins via arcgis.com and 91-divoc.com):
- Number: 25,612, total 1,309,541 (vs. day/day high of +36,161 on April 24
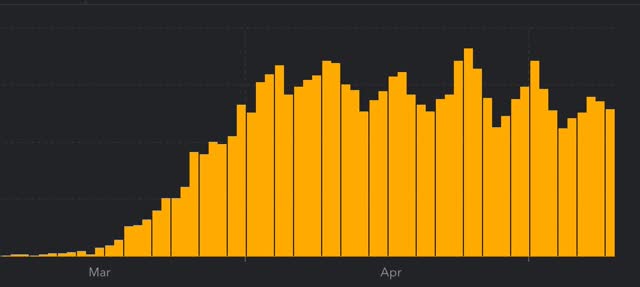
There has been a significant decrease in the number of new cases in the US. The US nevertheless has the worst record in the world, by far.
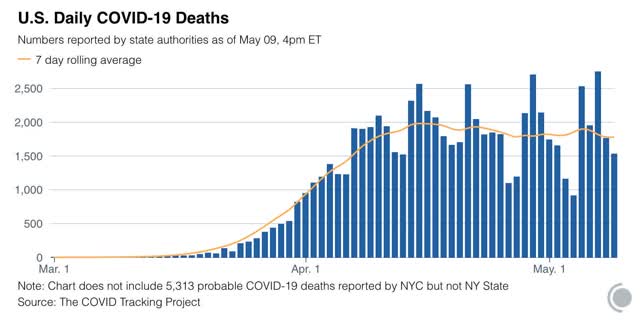
Number of deaths and infections and rate of increase of testing (from COVID Tracking Project)
- ***Number of deaths: 1,529, total 73,291 (vs. day/day peak of +2,700 April 29)
- Seven day average of deaths: 1,797 (vs. 2,058 peak on April 21)
-
- Number of tests: 300,842 (vs. 318,720 daily peak on May 7)
- Ratio of positive tests to total: 11.9:1 (new high - target is 15:1)
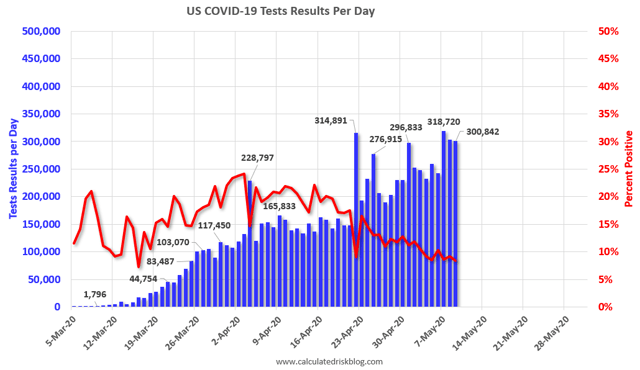
- 7 day average of tests: 272,000 (new high)
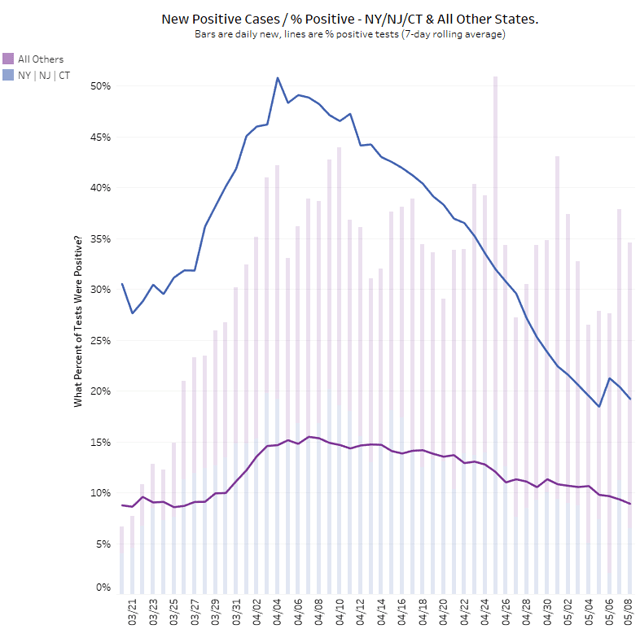
- 7 day average of tests: NY&NJ (33.9k/day) vs. rest of US:(238.1k/day)
- 7 day average of infections: NY&NJ (4.8k/day) vs. rest of US: (20.3k/day)
- 7 day average of ratio fo positive tests to total, NY&NJ (7.1:1) vs. rest of US (11.7:1)
In the past three weeks, as shown in the graph above, the percentage of positive to total tests has declined from about 20% to 8%. At this rate, within one more week the US as a whole should be at 6%, which, based on the history of South Korea, lockdowns can begin to be judiciously lifted and a thoroughgoing regimen of “test, trace, and isolate” can be begun.
However, the breakdown between NY&NJ and the rest of the US shows that although new cases the NYC metro have declined dramatically, with one positive for every 7.1 tests administered, many infections are still being missed. A smaller rate of infections are being missed in the rest of the country.
Summary for May 6
- The number of daily new infections, adjusted for testing, appears to have peaked two to three weeks ago.
- The number of daily new deaths may have peaked about 2 weeks ago, although this is less certain.
- The trend number of daily tests has improved dramatically in the past 3 weeks from an average of about 150,000-160,000 to about 270,000. Better still, for the last 2 weeks, new infections have declined, even with higher testing - a very positive sign.
- Although new infections in the NYC metro area have declined precipitously, many infections there are probably still being missed. The increase in infections in the rest of the US is most likely a function of the dramatic increase in testing in the rest of the country.
- My personal suspicion remains that the actual number of total infections in the US is about 5x the official number, or roughly 6.5 million, about 2% of the total population.
- Based on testing, a significant portion of the rest of the US outside of the NYC metro area (mainly rural areas) could soon transition to a “test, trace, and isolate” regimen, but there is no sign whatsoever of the necessary preconditions being put in place.
- Comparing those States which remain in lockdown vs. those that are “reopening” will be a major issue going forward.