- by New Deal democrat
A few days ago I wrote in agreement with Nate Silver’s point that the increased number of coronavirus cases outside of the NYC metropolitan area might mainly be due to higher numbers of tests being conducted - and therefore finding more cases.
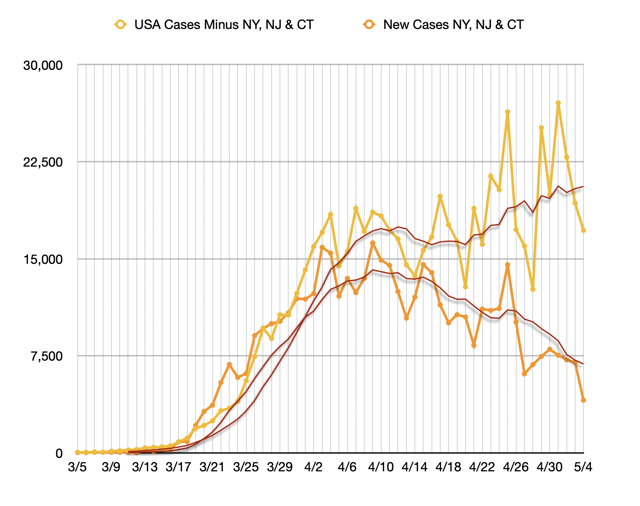
Here’s a graph that I used then to illustrate the underlying narrative: more cases outside of NY vs. fewer cases in the NY metro:

I still think Nate is correct. I also still want NY to “crush the curve” in order to serve as an example to other States, but a subsequent graph causes me to wonder if NY has been in even more dire straits than we previously imagined.
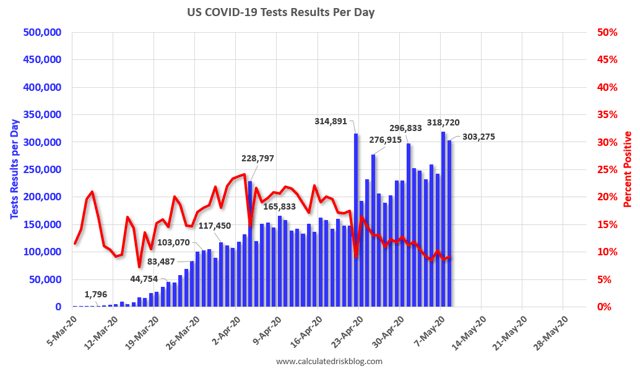
Let me start with the daily graph of total tests (bars) and the percent of positive tests compared with total tests (red line) that I have been running in all of my Coronavirus Dashboards:

Recall that back in late March and the early part of April, when positive test results were about 20% of the total, we were concerned that we weren’t testing nearly enough, and as a result were missing a lot of cases.
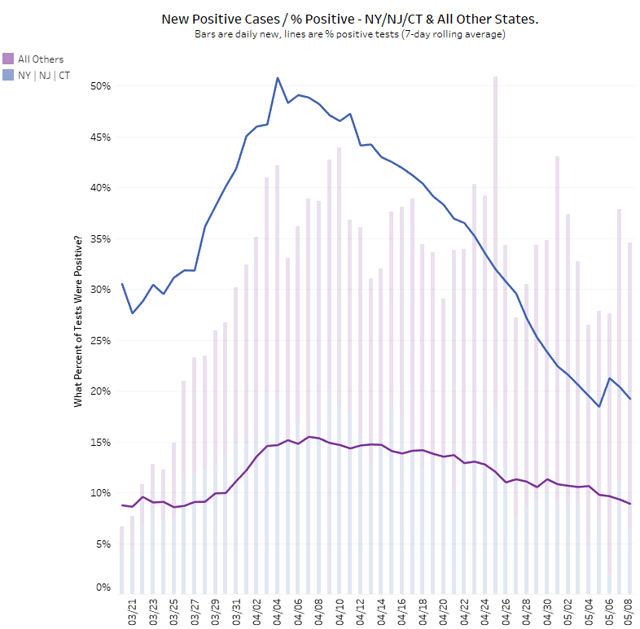
Now here is a graph that shows the same above data by showing new positive test results as a percent of all tests conducted, but divided between NY,NJ&CT and all other States:

Outside of the NYC metro area, positive results have declined from about 16% to 9% from their peak to the most recent data. At this rate, while we are undoubtedly still missing some cases, the situation isn’t nearly so bad as before.
But now look again at the three NYC metro States: there, positive results have declined from just over 50% to just under 20% - the same percentage, 20%, at which we thought we were missing an awful lot of cases nationwide. Just imagine how many cases must have been missed when 50% of all tests administered in NY were coming back positive!
Further, if the rate of positives in the NYC metro area were 9%, just like the rest of the country, we’d see a lot more cases. Remember that in NY, testing has only increased a little over 20% in the past month, while in the rest of the country it has increased about 65%. If NY’s testing had also increased 65%, how many more cases in NY would we see. Probably (unfortunately) lots!
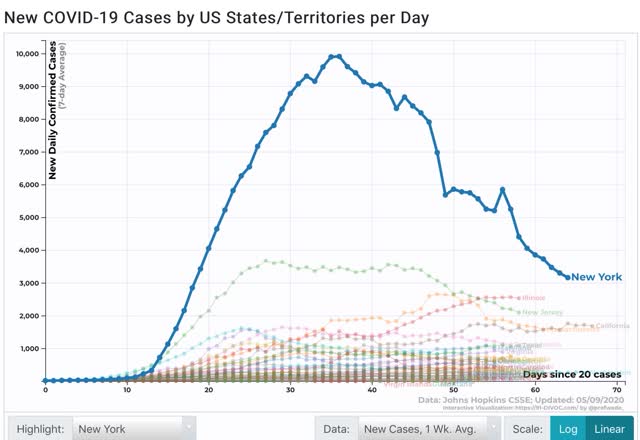
I suspect that the number of cases in NY did decline gigantically in the past month. The latest graph shows close to a 70% decline:

But I suspect that the true number of NY cases, now but even moreso a month ago, was relatively speaking much higher than what the first graph above shows - think maybe tripling the number a month ago, and doubling it now. NY would still be in decline relative to other States - but it would be from a much higher platform.