-by New Deal democrat
On Wednesday we got some excellent new residential construction numbers. I went into a lot more detail, showing how - exactly as I forecast - the turn in interest rates led the turn in housing sales by about six months, over at Seeking Alpha.
As usual, clicking over and reading helps reward me with a penny or two for my efforts.
While I am at it, on the subject of housing, here is a chart I am working on (not completed yet!) for another post, showing the maximum percentage decline in total and single family housing permits from expansion peak until the onset of recession, ever since reports started in the early 1960s, plus the decline from peak between the beginning of 2018 to the present:
| Recession onset | Total housing Permits | 1 unit housing Permits | —— | — |
|---|---|---|---|---|
| 12/1969 | -22.7% | -20.7% | ——— | |
| 11/1973 | -42.0 | -40.1 | ||
| 6/1980 | -36.8 | -43.7 | ||
| 7/1981 | -37.4 | -38.4 | ||
| 7/1990 | -44.3 | -35.1 | ||
| 3/2001 | -11.5 | -12.5 | ||
| 12/2007 | -49.2 | -58.7 | ||
| 2018-19 | -12.4 | -11.9 | ||
Note that in all cases but two (1969 and 2001), the declines were in excess of 30%. The recent decline, at roughly 12%, is almost identical to the decline prior to the 2001 recession. Why the 2001 recession happened despite the relatively small decline is important (and a subject of that other post to come!).
Also while I am at it, last October I wrote that Barring the Fed Reversing Course, Housing Has Peaked For This Cycle. Obviously with Wednesday’s permits and starts data, housing has exceeded its prior peak.
So what happened? Obviously the Fed did recently - very tardily in my opinion - change course. But the primary driver was a 1.5% decrease in mortgage rates, assisted by a 10% decrease in median new home prices.
Here’s a graph of 30 year mortgage rates since January 2013:
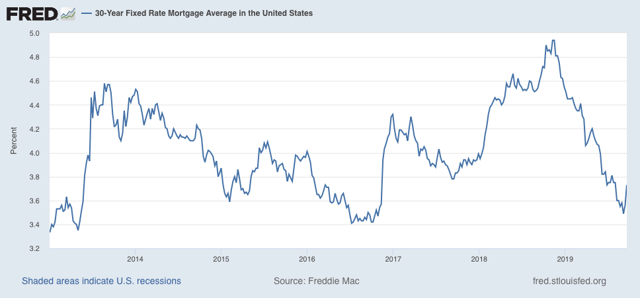
The “taper tantrum” of summer 2013 caused mortgage rates to rise 1.2%. Over the next 3 years, culminating with the Brexit panic low of summer 2016, rates went back down to 3.4%. Between the election of Trump and the Fed raising rates, by last November mortgage rates had risen to 5%. But in the last 11 months they have declined 1.5% (I don’t think it is primarily due to US recession fears, but that is another story).
Now here is the median new home sales price:
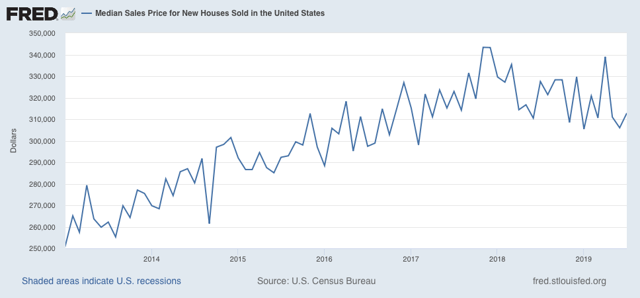
There was a 10% decline that started right at the peak of new home sales at the beginning of 2018.
Here’s what the decline in mortgage rates plus the decline in median prices did to the typical mortgage payment.
In November 2018, if you made a $30,000 down payment and took out a $300,000 30 year mortgage at 5% on the $330,000 median-priced new house, your monthly payment was $1610. Earlier this month, if you made the same down payment and took out a $270,000 mortgage at 3.5% on the $300,000 median-priced new house, your monthly payment had declined to $1212.
That’s almost a $400 difference per month. That is going to spark a lot of new demand — and it did!