- by New Deal democrat
Although the economy has obviously slowed down in the last 3 months, and I expect the data to continue to look near-recessionary for about a couple of months more, I continue to believe we will have a rebound in the second half of this year.
The biggest reason for expecting a positive jolt to the economy comes from the least expected source: housing. An increase or decrease in the number of houses built has been one of the surest harbingers of where the economy as a whole is headed 12 to 18 months later.
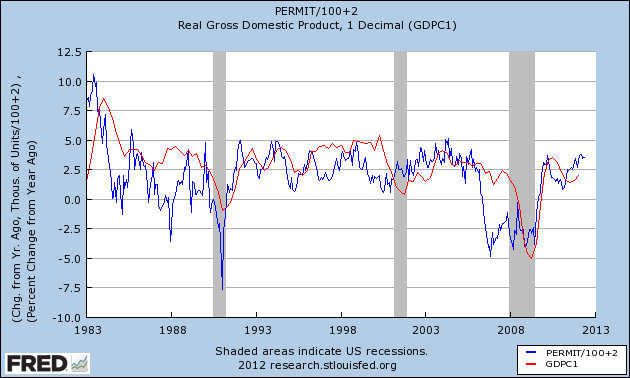
The below graph is an update of one I published a few months ago. It contrasts YoY GDP% growth (red) with the increase or decrease in the number of houses built YoY (blue). Generally speaking, for each increase of 100,000 in houses built YoY, there is a 1% increase in GDP growth YoY over trend:

This year we have generally built about 200,000 houses more than last year. That suggests that by the end of this year or early next year we should be seeing 3%+ YoY GDP growth. Of course GDP is an imperfect measure, but the fact remains that the higher the GDP, the more job growth, and that plus income growth for the average American is what I care about.
____________
From Bonddad: I want to add a few points.
1.) Housing has been a stealth story, hidden by all the problems in the EU and the BRIC slowdown. However, we've seen better and better numbers from the housing market. Granted, these are coming from the lowest level in decades, so saying there's an increase isn't saying too much. However, consider the following chart:
The housing affordability index is near an all-time high. Here is how the index works:
Value of 100 means that a family with the median income has exactly enough income to qualify for a mortgage on a median-priced home. An index above 100 signifies that family earning the median income has more than enough income to qualify for a mortgage loan on a median-priced home, assuming a 20 percent down payment. For example, a composite housing affordability index (COMPHAI) of 120.0 means a family earning the median family income has 120% of the income necessary to qualify for a conventional loan covering 80 percent of a median-priced existing single-family home. An increase in the COMPHAI then shows that this family is more able to afford the median priced home.Finally, remember that building permits are a leading indicator while total payrolls is a coincident indicator. Put another way, builders have to start building in anticipation of demand, largely because it takes awhile to get a housing community up and running.
As I've previously stated, I think part of the reason for the increase in real estate activity over the last say 6 months is simply that the market swung hard to the "not doing anything"side, which was in contrast to the "let's make housing the centerpiece of the US economy" stance of the early 2000s. However, we're starting to see a fair amount of activity in this part of the economy. It's fragile, but it is definitely there.
