- by New Deal democrat
Two years ago I stumbled on a long leading indicator with a good albeit noisy record: the real personal savings rate. This is simply the personal savings rate normed by the consumer price index. Here's a graph covering the last 50+ years comparing it (blue) with real GDP (red):
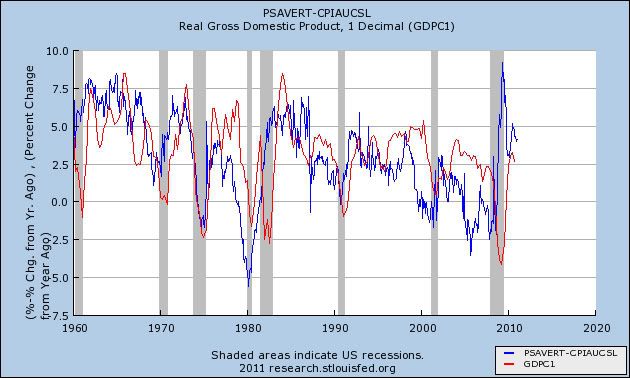
Although as indicated the relationship is somewhat noisy, the real personal savings rate appears to lead real GDP by 6 to 18 months.
I haven't looked at this relationship in over a year, and that's a shame because it's one long leading indicator which actually supports ECRI's recession call, albeit just barely, and just for a brief period of time.
Here's a more detailed look of the real personal savings rate alone from 1959 to the present:
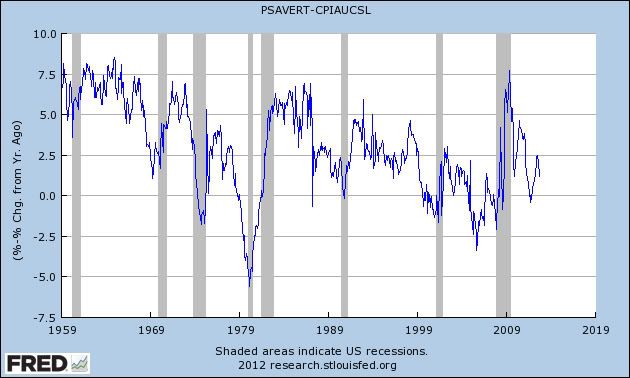
Notice that the real personal savings rate declines by at least 5% in advance of every recession, with the decline frequently beginning at least 2 years before the start of the next recession, and usually reaching the 5% mark beofre the recession's onset, or at least early into the recession. Furthermore, the indicator appears to have no false positives, i.e., every time the real personal savings rate has declined 5% or more, a recession has occurred. Finally, in all but two of those occasions, the real personal savings rate turned negative, at least briefly.
Fundamentally, the indicator makes intuitive sense. It is essentially an objective manifestation of consumer sentiment -- that is, how much of a savings cushion over the inflation rate do consumers feel comfortable with? When they become much less comfortable, as manifested by their savings rate, their spending contracts and a recession begins. Once they feel that they have an cushion of savings and can spend more again, the economy expands.
Is it different this time? The real personal savings rate hit a 40+ year peak just after the end of the last recession. It declined over 5%, but remained positive, for a very brief time near the end of 2010. Two quarters later, quarterly GDP growth approached zero. Then, after a rebound, the indicator actually went negative for several months at the end of 2011. Based on past data, this is a recession signal for 6 to 18 months later. We are now right in the middle of that window. Here's what the graph comparing the real personal savings rate with real GDP shows, zoomed in on the last ten years:
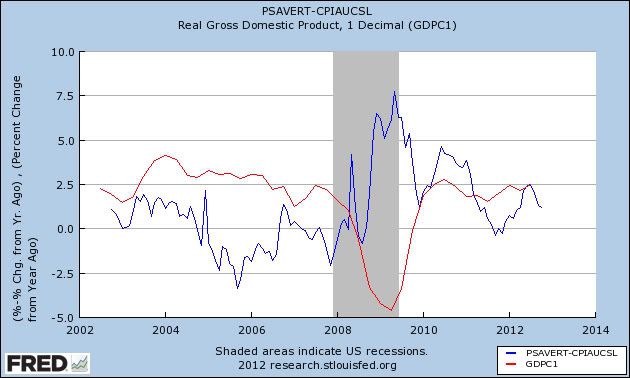
Notice that the dip into negative territory was very brief. The indicator has been positive all this year. In the past, when the indicator, having signalled recession, then turns positive, it has generally meant that the recession is within 6 to 12 months of ending. In other words, even if the real personal savings rate suggested that a recession was likely to begin this year, it also suggests that any such recession should be ending right about now.
No one indicator is infallible of course. It is nevertheless interesting that this indicator was first tripped at the end of 2010 when ECRI said their long leading index started to decline, and turned negative when ECRI went on record as saying that a recession (then called to begin by the end of 2011) was inevitable. My own version of ECRI's Long Leading Index turned positive in early 2011. I know of at least one other variant that closely matches the Long Leading Index which turned positive later in 2011. If the long leading indicators are positive, that could be one reason ECRI hasn't mentioned them at all in any of their public communications for at least the last nine months.
One final note: even though the real personal savings rate is positive, it is very weakly so. It's just shambling along in a living dead sort of way.