
The Brazilian market's weekly chart still shows that the market is near multi-year lows. Prices are below the 200 day EMA, and the shorter EMAs are below the 200 as well. Momentum is weak, and the CMF is barely positive.

The Russian market's ETF is still trading in a range between 24 and 32 -- a range that has existed for nearly a year.

The Indian ETF is still trading in a range between the 47.5 area and 62.5. However, momentum is rising and the CMF shows an influx of money. They key to this chart will be if prices can continue above the 200 day EMA, which has provided upside resistance the entire year.

After spiking earlier this year due to massive drought conditions, the grains complex has been heading lower for the summer and fall. Right now, prices are right at the 50 week EMA.
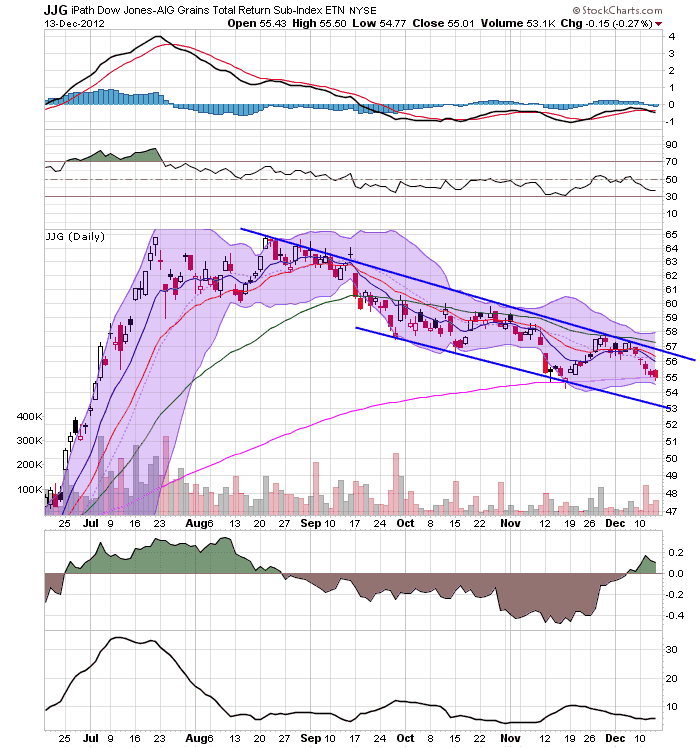
On the daily chart, notice that prices have been moving lower in a very disciplined manner for the last three and a half months. Prices are right at the 200 day EMA, with a stabilized MACD. However, we see a slightly positive CMF.