- by New Deal democrat
We now know the values for July for 3 of the 4 indicators that the NBER uses to mark economic peaks and troughs.
Nonfarm payrolls were reported up 163,000 for the month. Further, their YoY growth has been acceleratiing slightly a compared with earlier this year.
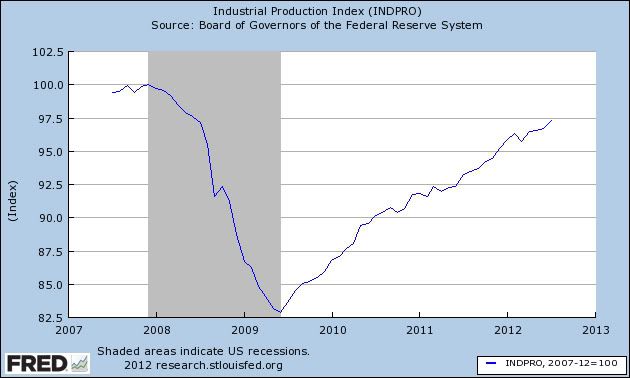
This morning Industrial production was reported at +0.6. Production made another post-recession high in July, and is now only about 2.5% less than its pre- Great Recession peak, as shown on the graph below:
The YoY growth has decelerated slightly.
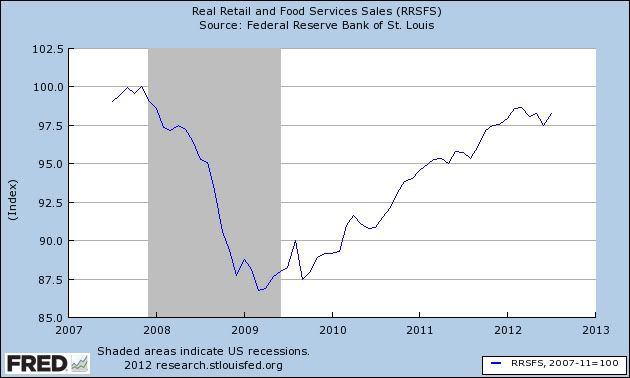
Yesterday retail sales were reported up 0.8% for July. With this morning's flat CPI report, we now know that real retail sales were also up 0.8%. (Based on Gallup's spending data, I had thought these would come in poor. I was wrong, but happily so.) This reverses last month's decline, although we are still below the levels set in February and March. These are about 1.7% under their pre- Great Recession peak:
The final coincident indicator, real income, won't be reported for another couple of weeks. Barring downward revisions, however, it seems likely that the economic expansion continued in July.