 - by New Deal democrat
As I said yesterday, Barry Ritholtz's argument that house prices will decline further rests generally on three arguments:
(1) housing is not actually affordable by traditional measures. Down payments remain unrealistically high, and buyers cannot qualify for mortgages;
(2) there is a large overhang of "shadow inventory" most especially including but not limited to foreclosures, which are primed to put renewed downward pressure on prices; and
(3) potential buyers, especially younger buyers, are fearful of the potential immobility that comes with owning a house vs. renting
Today we'll take a look at affordability. Barry makes 3 important assertions to justify his opinion that house prices must go lower, because they still aren't affordable enough:
1. the home price to median household income ratio is still higher than the norm.
2. Home buyers don't have sufficient savings to come up with a $40,000 down payment to afford the median priced house
3. The NAR's "housing affordability index" fails to take into account household income and savings
I addressed all of these issues several months ago in How affordable is housing? I encourage you to read the whole piece, but I'll restate it in condensed form here.
Over the long term the median house has cost about 2.7 to 2.8 times median family income (sorry, I don't have a more updated graph to show you, but I'll set forth the more recent data immediately below):

Median family income differs from median household income in that the latter includes one-person households, the former does not. According to the NAR's existing home sales report, the median home purchased cost about $165,000. Meanwhile the median family income is about $60,000. That means it costs about 2.75 times median income to purchase the median priced house -- in other words, right at the long term average.
Barry highlights median household income vs median NEW home prices:
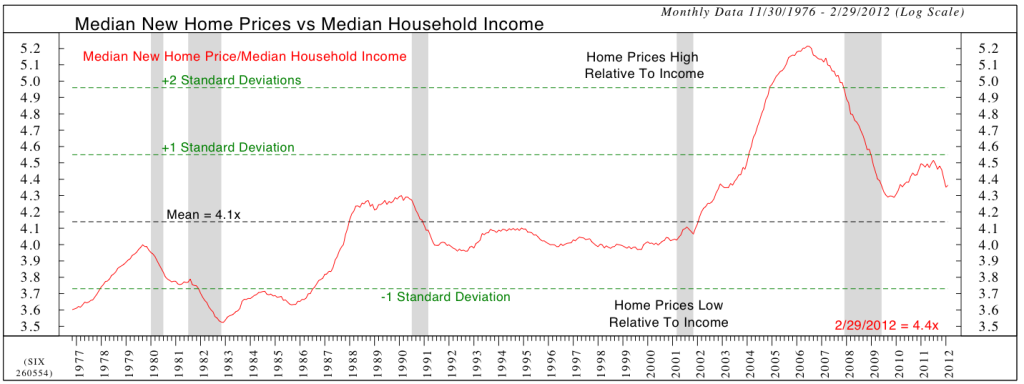
Admittedly that has not declined to its long term average, but new homes are only a small share of the overall market. I don't know why housing prices should be decided based on that slice alone. When you consider the broader range of houses available, per my discussion above, we have already declined to the long term average.
Further, Barry's chosen metric fails to take into account mortgage rates. In 1980 mortgage rates were running at about 20%, In 1990 they were about 10%. Now they're about 4%. That means the monthly carrying cost of a mortgage on an identically priced house is only 1/5 what it was in 1980.
Put another way, the same nominal disposable income today can support 5 times the mortgage amount as it could in 1980. That means, at any given home price, there should be a much higher level of demand. By simple operation of supply and demand, we ought to expect that home prices must be significantly higher to bring supply into equilibrium with that heightened demand. That explains a great deal of the generally positively sloping ratio between house prices an median income shown in the graph Barry relies upon.
CR also makes the point in response that there has been a slight upward slope in the price of housing over the long term, as the US population has increased by 50% in the last 30 years, but God isn't making any more land.
Barry's second point is that households can't come up with a $40,000 down payment for the median house. Presumably he is thinking of 20% of $200,000. But again, the median existing home sells for about $165,000. 20% of that number is $33,000.
Beyond that, he makes in my opinion an important mathematical error. First time home buyers aren't the ones buying the median priced house; rather, "move up" buyers do. First time buyers buy starter homes, and so don't have to come up with the down payment for the median priced house. Throughout the last 6 years, houses at the 25th percentile have featured list prices of about 2/3 of the median home. Using that as our estimate, a first time home buyer only has to come up with about $22,000, or 20% of $110,000. If they have trouble with $22,000, there is every reason to think they will do what I did when I bought a starter home long long ago in a galaxy far far away. I put up 10% and obtained loans from family members for the other 10%. Once we start thinking in terms of coming up with $11,000 to put towards a starter home, it is much more doable, even in today's depressed climate.
For the same reason, move-up households only have to come up with about $11,000 ($33,000 - $22,000) after selling their starter home. I will grant that families who bought houses anywhere near the peak of the market will have a hard time moving up, since their equity has declined, in some cases probably to zero. But any family which has owned its home for 10 years and resisted the siren call of home equity withdrawal should have no problem.
Indeed, contrary to Barry's argument that households do not have the savings to come up with a down payment, while the personal savings rate at less than 4% may not be stellar, the amount of savings that households have stashed away since the onset of the last recession is considerable, and indeed is generally better than at any point in the last 20 years:

Barry's final argument as to affordability is that the NAR's affordability index doesn't take into account household income. That's easy enough to do, however. We start out with the interest rate on a 30 year mortgage and divide that by the Case Shiller 20 city average house price. That gives us a general affordability rate. When we divide that number by average hourly earnings, we can easily see how affordable it is for a family earning the average hourly wage to afford the typical mortgage payment for a typically priced house. That is exactly what this next graph shows us:

The above graph tells us that, despite lackluster wage growth, the renewed decrease in mortgage rates, together with the steep decline in housing prices, have made mortgage payments far more affordable than at any point in the last 25 years.
Finally, Barry says that house prices, like other asset bubbles, typically overshoot the median on the way down. That's very true, but that doesn't mean that it must be accomplished by nominal prices. Rather, if nominal prices rise, but at less than the rate of inflation - and generally remain flat for a very long time after they bottom - then the overshoot can be accomplished in real terms without nominal prices declining further at all.
In summary, Barry's argument about affordability does not necessarily imply any further decline in nominal, as opposed to real, house prices.
Next: Shadow inventory and foreclosures