There is a commenter who always asks me whether stabilization in housing prices is really a good thing if the median family income can't afford the median priced house. That's a fair point and I've been promising to look into the issue. So, what is the state of housing affordability? There is no one single answer, but the results may surprise you.
In determining if the median American family can afford the median house, there are at least two separate factors to consider: (1) how affordable is the typical down payment? and (2) how affordable is the mortgage? Let's look at each of them in succession.
The down payment, of course, is a percentage of the sale price of the house. So if, for example, we want to know how affordable a 20% down payment is, all we have to know is the sales price of the typical house, because then we can just divide it by five.
There are several ways of measuring historical house prices. For example, here is a graph from the blog jparsons.net, which measures house prices since 1970, first by using FHFA data, and then segueing to Case-Shiller data beginning in 1987. The blue line is nominal pricing, and the red line represents prices adjusted by the CPI:

Notice that even the red line is gradually increasing over time, probably reflecting increasing population vs. the fact that "God isn't making any more land."
Since housing prices themselves are a large part of the CPI, however ("owner's equivalent rent"), I think a better way to measure the price of housing for a typical family is to divide it by average hourly earnings, which is what the following graph does for both Case-Shiller series (the 10 city series began in 1987, and the 20 city series in 2000):

This shows that, using either series, the housing bubble has been entirely deflated. The 20 city series is lower than it was at its inception, the 10 city series slightly above.
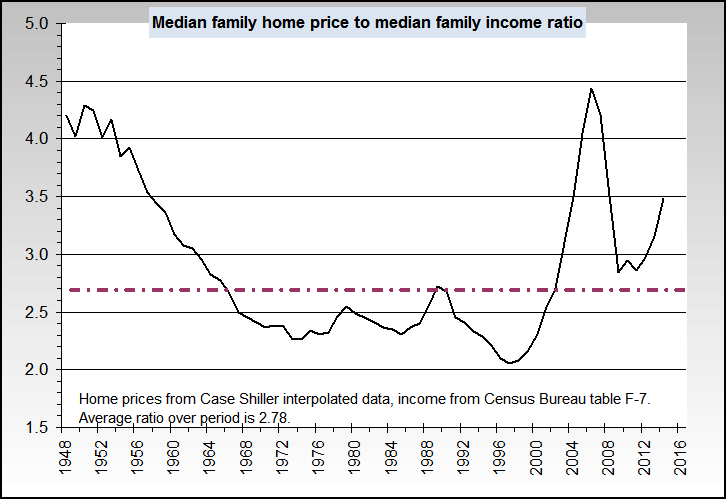
But even that does not entirely answer our question. For that, let's look at the long-term graph comparing median family income from Nowandfutures with the sales price of a median house, which is what the following graph does from 1967 to mid 2011:

Note that the long term median price is 2.78 times median family income (I have seen averages of 2.7 elsewhere).
So where do we stand now? For that I need to do a little explaining of terms. "Median family income" is a subset of "median household income." The latter includes. e.g., households consisting of a single adult. "Median household income" reached its peak in real terms in 1999. At mid-year 2011, two researchers measured it at $49,909. In September, the Census Bureau estimated it at $49,445. The study by the two researchers mentioned above estimated that median household income had actually fallen by about 7% since the bottom of the recession in 2009.
"Median family income", by contrast, was $60,395 when last measured by the Census Bureau for 2010. 2.78 times that income is $167,900. 2.7 times that income is $164,100.
And what was the median sales price of a house in December 2011, the last month for which we have a measurement? According to the National Association of Realtors, it was $164,500. By contrast, at the peak of the bubble, the median sales price was $221,900. If "median family income" did not fall between 2010 and 2011, according to this measurement, right now we have just reached the point where the median family income can reaasonably purchase the median house sold.
Several caveats are in order. First of all, in 2009 median family income was $61,030. Like median household income, it fell between then and 2010, although by only 1.1%, At least a slight further decline between then and December 2011 probably did occur. Additionally, we know that the median asking price for homes nationwide, as estimated by Housing Tracker, is slightly over $200,000. This tells us that it is the lower-priced houses for sale which are actually being sold, while higher priced houses are sitting unsold. It is reasonable to ask if those prices are going to fall further. If they do, then we will "overshoot" the long term median average to the downside -- i.e., house prices will become even more affordable than the long term norm.
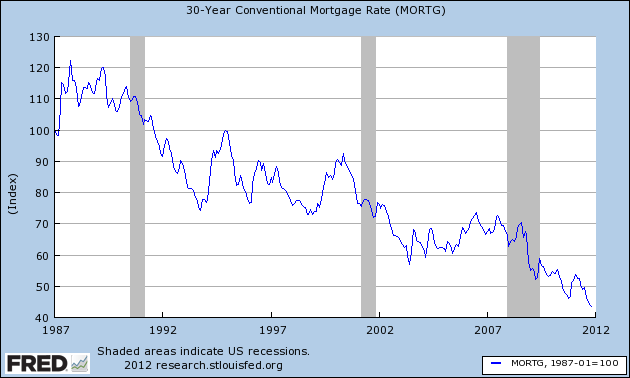
Next, let's turn to mortgage payments. Mortgage rates have fallen from 20% in 1980 to under 4% now. The below graph shows this from 1987:
Another way of looking at the same data is to consider affordability, i.e., how much house can I buy for the same mortgage payment. As this next graph shows, that price has more than doubled since 1987:

But house prices obviously haven't remained stagnant either. So this next graph factors in average house prices as measured by the Case-Shiller 10 city series. It tells us how affordable the mortgage payment for a typically priced house has been at the prevailing mortgage rate since 1987, and here the story looks quite different:

The mortgage payment it took to buy the typically priced house reached its least affordable at the peak of the housing bubble, where at a typical interest rate, the average mortgage would only purchase less than 40% of the house it could in 1987. Only in the last 12 months has it finally approached its 1987 level.
But once again, even that does not tell the whole story. For that, we need to ask how affordable was the typical mortgage payment for the typically priced house for a family earning the average hourly wage? That is what this next graph shows us:

The above graph tells us that a family earning the average hourly rate, at a typical mortgage interest rate, could afford only 70% of the typical mortgage for a typically priced house at the peak of the housing bubble compared with 1987. Despite lackluster wage growth, the renewed decrease in mortgage rates, together with the steep decline in housing prices, have made mortgage payments far more affordable than at any point in the last 25 years.
The same trend is shown in the National Association of Realtor's "housing affordability index," shown below:

So, there are at least two answers to the question "how affordable is housing?" The first answer is that, in terms of down payments, house prices are probably very slightly -- as in 5% or less -- above their long term norm. Since it is mainly lower priced housing that is selling, it is possible that higher priced housing will continue to decline in price and if so, there will be an overshoot to the downside (which is good for home buyers). The second answer is, that at least in terms of mortgage payments, now really is a good time to buy a house. We are probably at or near generational lows in affordable mortgage payments, particularly after factoring in family income.