With the release of real retail sales Monday and industrial production yesterday, we now know the numbers for 3 of the 4 big coincident indicators for the economy. Payrolls were reported two weeks ago and personal income hasn't been reported yet. With housing permits being reported yesterday, we also know what the most important long leading indicators are forecasting through early next year.
Let's start with the long leading indicators. These include real M2 (green) and corporate bond interest rates (inverted)(red) as well as housing permits (blue) :
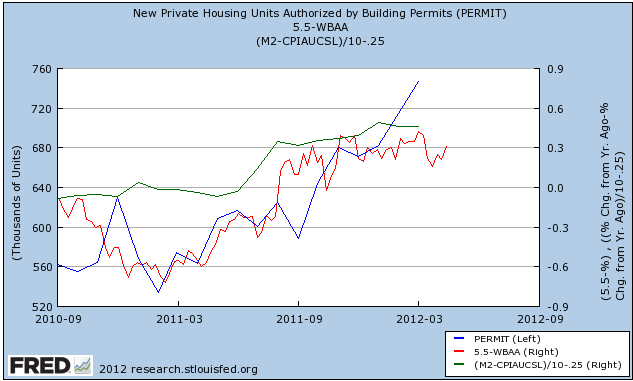
Long leading indictors forecast the economy 12+ months later. Many people also include the yield curve in this group. The problem with the yield curve is that it does not function well in times where deflation is a real possibility (it never inverted between 1930 and 1950, for example). In any event, 12+ months ago was just as these indicators were approaching a nadir. Hence my belief that the weakness shown in several series in the last few weeks is real.
But note that beginning in spring 2011 all three turned up. This tells me the weakness will be short lived and we should expect relatively strong growth as we go into the second half of this year.
Next let's look at shorter leading indicators, which forecast the economy 6 to 8 months later. The raw ECRI WLI is a good index of these. In the graph below it is shown in orange (h/t Kirk Lindstrom):
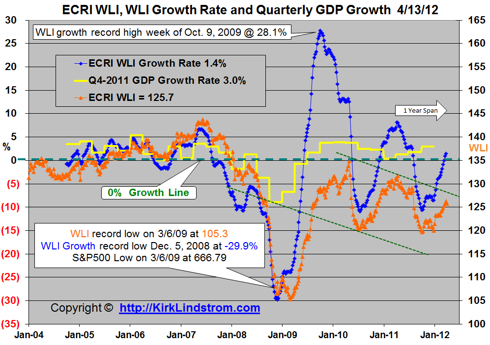
The big downdraft in the WLI occurred last September, 7 months ago. This confirms the forecast for weakness in the next few months.
Finally, here are the 4 big coincident indicators -- real retail sales (blue), payrolls (red), industrial production (green), and real personal income ex transfer payments (orange):
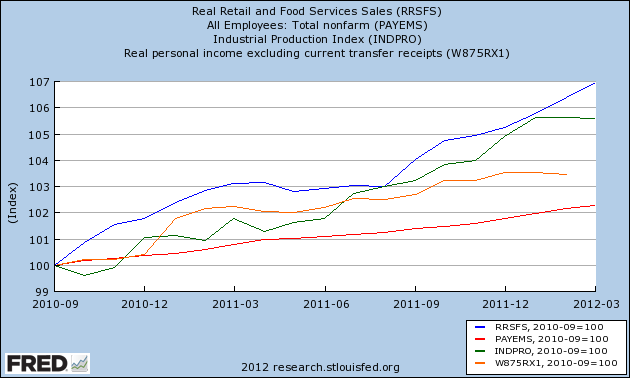
Through March, two are rising and one is flat. We don't know about real personal income yet, although it has declined slightly in the last couple of months. Two of the three that we do know are weaker than they were a few months ago, but notice that the trends were much worse last spring.
Digging a little deeper, let's look at one of my favorite comparisons, real retails sales vs. payrolls:
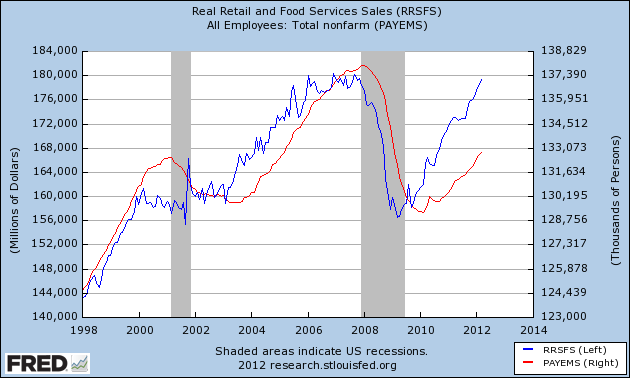
As this graph plainly shows, consumption leads jobs. With real retail sales strongly positive through March, it is likely that payrolls will continue positive through the second quarter.
Next, here's the same relationship on a YoY% basis (with retail sales divided by 2):
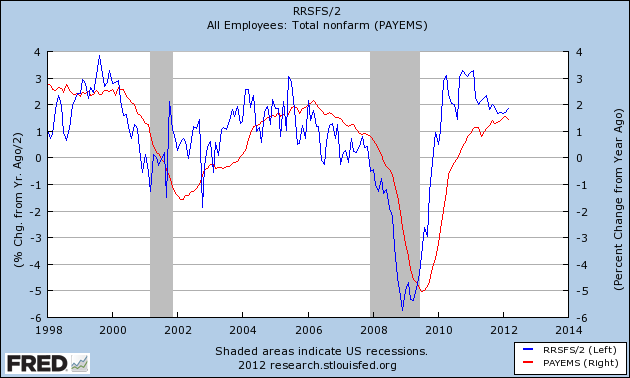
Real retail sales do a decent job of forecasting amplitude as well as direction, although obviously not perfect. With real retail sales continuing to run at about 5% YoY, it is likely that payrolls will not deviate much from their current 1.5% YoY rate.
The bottom line is that, barring extreme revisions, the first quarter of 2012 showed continued growth, and it is likely that jobs growth persists in second quarter as well.
Per my recent commentary, I do think there will be a slowdown in that growth for the next several months, but I do not see anything strong enough to take us into actual contraction at this time. To the contrary, the upturn of the long leading indicators last spring and the short leading indicators since the beginning of this year buttress the argument that we should see relatively better growth in the second half of this year.