With Bill McBride a/k/a Calculated Risk calling for a nominal price bottom for housing in March, it appears worthwhile to update my chart of asking prices from Housing Tracker.
Back in June when I first started to publish this asking price data, I noted that:
The Housing Tracker trend in asking prices appears to run 1 to 4 months ahead of the Case-Shiller sales data,...That indeed is what has happened. Median asking prices for houses turned positive YoY in December, and have remained positive since. Here is the updated chart:
[T]he rate of decline [in asking prices for houses] is abating, and actual real time data shows that nominal if not inflation adjusted stability may indeed be reached as soon as early next year.
| Month | 2007 | 2008 | 2009 | 2010 | 2011 | 2012 |
|---|---|---|---|---|---|---|
| January | --- | -7.5% | -11.5% | -5.8% | -8.7% | +2.9% |
| February | --- | -7.8% | -12.0% | -5.2% | -8.4% | --- |
| March | --- | -8.3% | -10.9% | -5.0% | -7.3% | --- |
| April | -2.7% | -8.6% | -9.6% | -5.0% | -6.8% | --- |
| May | -3.5% | -9.1% | -8.1% | -5.0% | -5.6% | --- |
| June | -5.0% | -9.8% | -7.0% | -5.0% | -4.4% | --- |
| July | -5.4% | -10.4% | -6.1% | -5.1% | -4.2% | --- |
| August | -6.0% | -10.6% | -5.5% | -6.1% | -2.8% | --- |
| September | -6.2% | -11.1% | -5.1% | -6.6% | -1.7% | --- |
| October | -6.7% | -11.4% | -4.5% | -7.0% | -0.9% | --- |
| November | -6.6% | -11.7% | -4.5% | -6.7% | -0.7% | --- |
| December | -7.2% | -11.4% | -5.6% | -7.8% | +1.1% | --- |
Asking prices at the 75th percentile (more affluent houses) turned positive In October and by January asking prices for these were up +4.8%. Asking prices at the 25th percentile (more affordable housing, slightly below the average price of home sales according to the NAR) also finally turned YoY positive in January 2012, up a whopping +0.1%.
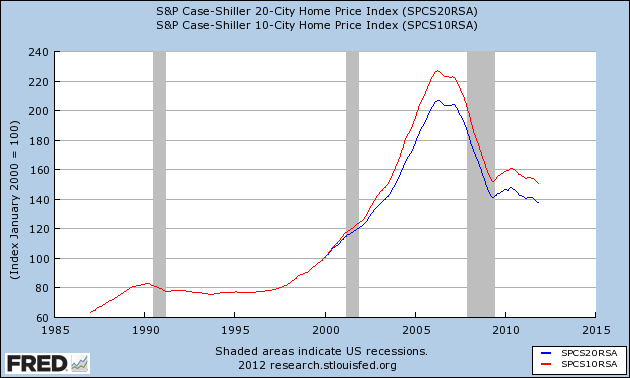
In contrast, Case-Shiller comparable sales prices for houses continue to fall, and in the last month, fell at an increasing rate:

It is extremely unlikely that this divergence between asking prices and sales prices is going to continue. Something's gotta give. Either asking prices will start to decline again, or sales prices will firm up.
Frankly, it is hard for me to believe that 6 years into the housing bust, sellers have suddenly become unreasonably stubborn with their asking prices. This is what doubters, like Kieth Jurow, who disagrees with CR's call, need to explain. In fact, the firming of asking prices appears to have everything to do with and be consistent with the strongly declining inventory that is also featured on the Housing Tracker site. Currently that inventory stands at 844,668 compared with 1.075 million last February and 1.560 million at its peak in October 2007. I also note that Housing Tracker data is current through last week, whereas the Case-Shiller data is only current through November.
So I still expect the sales data to confirm the Housing Tracker bottom probably by summertime. If so, please note that like Bill McBride, I expect this will only be a bottom in nominal and not real, inflation adjusted prices.
P.S.: I'll address the issue of housing affordability in another post.