- by New Deal democrat
At the turning of the calendar, it's time to celebrate the circle of lif.... er, the living dead! . . .

BWA-HAH-HA-HA-HA! from the Nerds of the Living Dead.
See you next year.
Since I'm not a highly paid Wall Street pundit, I simply rely upon the LEI for the short term, and the yield curve for the longer term with the caveat of watching out for deflation. The simple fact is, with one exception, if real M1, and real M2 (less 2.5%), are positive, and the yield curve 12 months ago was positive, the economy has always been in expansion.At midyear I updated the forecast, describing it as one falling between Scylla and Charibdid:
The simplest forecast, therefore, is that since the LEI were positive all during 2011, and since both M1 and M2 are positive ... and since the yield curve did not invert at any point in the last year, so long as we don't fall into deflation we should have growth all through 2012.
.... [Further,] all of ECRI's long leading indicators have turned up since last spring, with real M2 and the DJBA making new all time highs....
This, plus the positive yield curve, tells me that for the second half of 2012, the indicators are really in agreement -- there will be growth.
So what do the shorter leading indicators say about the first half of 2012?
.... Ultimately the question as to whether the trend is slightly positive or slightly negative in the first part of 2012 becomes whether housing will show enough actual strength, and whether the Oil choke collar will weaken sufficiently, to support US growth if manufacturing and exports falter.... [M]y best judgment is that we will avoid recession, but that at least one quarter of negative GDP, with the likelihood greater in this quarter than the second quarter, can't be ruled out.
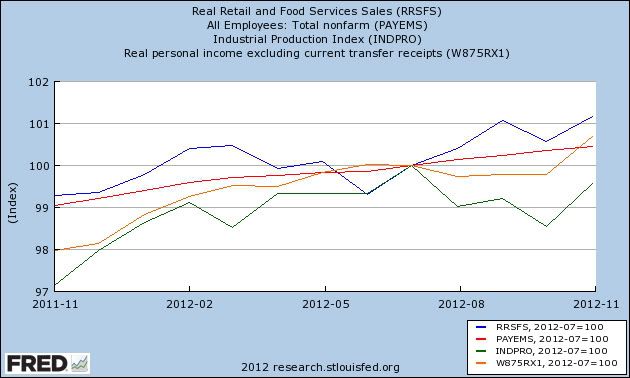
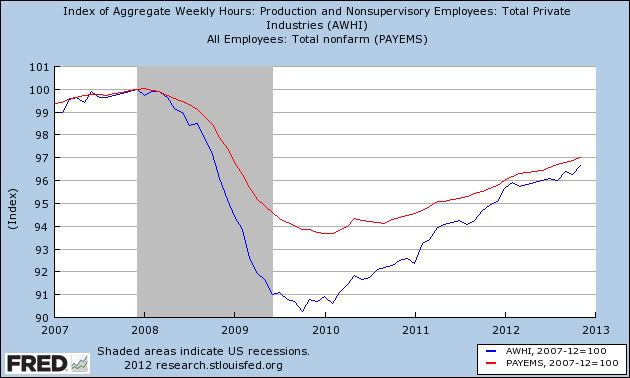
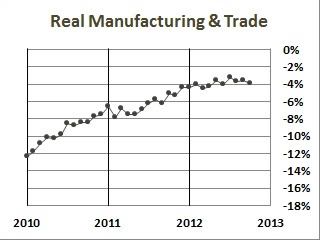
I really set myself up for failure in January with my forecast for this year of weakness in the first half, most likely in the first quarter and probably as bad as 2006 but not quite as bad as the recession of 2001, followed by strength in the second half. That's a really narrow passage to navigate!Looking back, it appears I was right on the trajectory but wrong on the timing. Judging by the 4 coincident indicators of sales, production, income, and jobs, weakness did begin by the end of the first quarter and continue thereafter, but instead of the economy re-accelerating in the second half, it was late summer and early autumn that waw the weakest numbers. Here's the graph of these four coincident indicators through 2012:
....
Initial strength has been followed by progressive weakness that started with a poor March payrolls report. I'm still expecting the weakness to end this summer sometime, partly because
- (1) the long leading indicators of housing permits and starts, interest rates, and money supply all turned positive by the second quarter of last year and have continued to be positive. ...
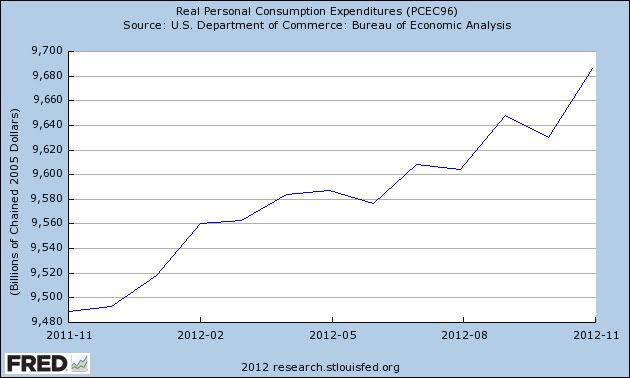
- (2) gasoline prices hit their seasonal peak at about the same level as last year, and have already backed off over 10%, putting more money in consumers' pockets, and
- (3) past patterns of inflation and deflation suggest that when YoY price deflation is at its worst, that is when the economy is at its slowest, improving thereafter.... [T]he YoY [inflation] comparison is going to start turn positive by about September, and based on past patterns that means the weakness bottoming out some time this summer, and stronger growth resuming thereafter
[H]ousing prices have already "faced the brunt of market forces" without support for a full year, as a result of which they have been falling closer and closer to equilibrium, the rate of decline is abating, and actual real time data shows that nominal if not inflation adjusted stability may indeed be reached as soon as early next year.Prices did indeed bottom, according to the Case-Shiller index, in March of this year. My forrecast of this bottom was months ahead of others, including Bill McBride's. Not too shabby.
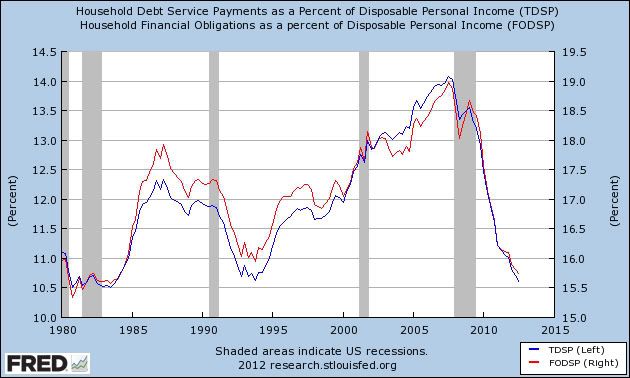
The household debt service ratio (DSR) is an estimate of the ratio of debt payments to disposable personal income. Debt payments consist of the estimated required payments on outstanding mortgage and consumer debt.Both measures declined substantially, after a relative pause about a year ago for several quarters. I've combined the two measures into a single graph:
The financial obligations ratio (FOR) adds automobile lease payments, rental payments on tenant-occupied property, homeowners' insurance, and property tax payments to the debt service ratio.
U.S. home owners are refinancing their mortgages at the fastest clip since 2005, but the difference now is they are putting cash in, not taking it out.This equates to about 0.6% of all retail spending per month.
At the going rate, 25 percent of all first-lien U.S. mortgages will be refinanced this year, according to LPS Applied Analytics. That represents about $7.1 billion —just through June of this year — in savings on monthly payments, according to economists at Freddie Mac, who ran the numbers for this report.


 for about 87% of the population. for $40 and two t-shirts at $35 each. This year, two sweaters were purchased at $35 each and one t-shirt for $45. than t-shirts.


