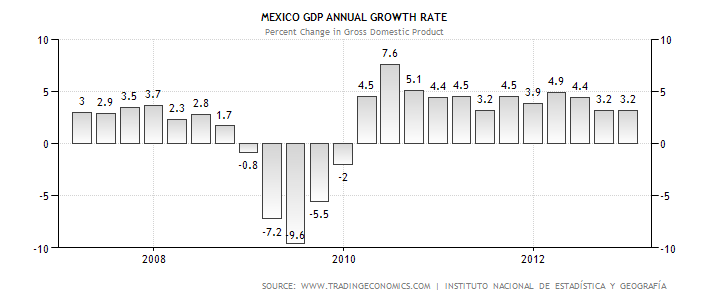
From Bloomberg:
Mexico’s economy grew less than
forecast by any of the analysts surveyed by Bloomberg in the
second quarter as industrial production declined on a sluggish
U.S. recovery.
Gross domestic product expanded 1.5 percent from the year
earlier, rebounding from a revised 0.6 percent growth rate in
the previous three months, the National Statistics Institute
said on its website today. The median estimate of 17 economists
surveyed by Bloomberg was for growth of 2.3 percent. The economy
contracted 0.7 percent from the previous quarter.
The central bank cut its growth forecast for this year to
between 2 percent and 3 percent this month from 3 percent to 4
percent on stagnant exports to the U.S. and muted public
spending. Growth will accelerate in both the third and fourth
quarters, rising to 4 percent next year as the U.S. recovery
strengthens and the government passes key economic reforms,
according to the median estimate in a Bloomberg survey.
Industrial production fell 0.6 percent in the second
quarter from the year earlier, the statistics agency also said
today. The construction sector contracted 4 percent over the
same period amid a drop in government spending.
Here's a chart of the data:
And retail sales continue to show hit and miss year over year results:
And total production has stagnated for over a year -- although it is at higher levels than before the contraction:
Let's turn to the Mexican ETF, starting with the weekly chart:
The main feature of the chart is the rally from mid-2012 to the spring of 2013, when the market rallied about 45%. Since then, however, we've seen two waves of selling. The first in the mid-Spring, and the second that started three weeks ago. The logical price target for the second wave of selling is the 200 week EMA.
On the daily chart, the relief rally that took place starting in early July looks incredibly weak; it occurred on weak volume while the MACD was still in negative territory. Once prices got just above the 38.2% Fib level, they ran out of steam and started moving lower.
Showing posts with label Mexico. Show all posts
Wednesday, August 28, 2013
Tuesday, June 11, 2013
South American ETFs Are Selling Off
Consider the following weekly price charts:
The Chilean ETF has an uptrend connecting the mid-2012 and end of 2012 lows. Prices broke that trend a few weeks ago and are now below the 200 week EMA. Additionally, they are sitting at price support established in mid-2012. Momentum and volume readings confirm the break-down.
The Mexican ETF actually broke trend earlier this year, but consolidated sideways between the 70 and 76 price level. Prices have bee moving lower for the last few weeks, breaking price support established earlier this year. Momentum is dropping and volume is flowing out of the market.
The Columbian ETF broke its uptrend earlier this year. Over the last few weeks we've seen some volume spikes as the selling has accelerated. Momentum is dropping and money is flowing out of the market.
Peru's ETF had a solid uptrend that lasted over a year and a half. But prices moved lower about 6-7 weeks ago, printing strong bars lower. Also note that momentum is declining and the CMF is negative.
Brazil has been trading at low levels for the last year because of a slowing economy. However, prices have dropping sharply over the last few weeks, bringing momentum down and leading to a slightly negative CMF reading.
The Chilean ETF has an uptrend connecting the mid-2012 and end of 2012 lows. Prices broke that trend a few weeks ago and are now below the 200 week EMA. Additionally, they are sitting at price support established in mid-2012. Momentum and volume readings confirm the break-down.
The Mexican ETF actually broke trend earlier this year, but consolidated sideways between the 70 and 76 price level. Prices have bee moving lower for the last few weeks, breaking price support established earlier this year. Momentum is dropping and volume is flowing out of the market.
The Columbian ETF broke its uptrend earlier this year. Over the last few weeks we've seen some volume spikes as the selling has accelerated. Momentum is dropping and money is flowing out of the market.
Peru's ETF had a solid uptrend that lasted over a year and a half. But prices moved lower about 6-7 weeks ago, printing strong bars lower. Also note that momentum is declining and the CMF is negative.
Brazil has been trading at low levels for the last year because of a slowing economy. However, prices have dropping sharply over the last few weeks, bringing momentum down and leading to a slightly negative CMF reading.
Wednesday, May 29, 2013
Market Analysis: Mexico
On May 16th, I highlighted the current Mexican president's reform agenda along with an upgrade in Mexican debt -- both of which were positive developments for the economy.
Yet the next day, 1Q GDP was issued, and the news was decidedly bearish:
Gross domestic product in the first three months of the year rose 0.8 percent from the year-ago period, less than the 1.1 percent median estimate in a Bloomberg survey of 18 economists. GDP grew 0.5 percent from the previous quarter, an annualized rate of 1.83 percent. The median estimate from seven analysts surveyed by Bloomberg was for a 0.3 percent gain.
The economy is growing at its slowest pace since GDP contracted 6.2 percent in 2009 in the aftermath of Lehman Brothers Holdings Inc.’s collapse. Today’s report showing industrial output is contracting increases the probability policy makers will cut rates as soon as July, said Gabriel Casillas, chief economist and head of research at Grupo Financiero Banorte SAB.
“It’s a very low growth figure and shows the economy is decelerating,” Casillas, who is based in Mexico City, said in a telephone interview. Mexico was hurt by “the slowdown in manufacturing of the U.S. that started in the fourth quarter of last year.”
And retail sales have contracted on a year over year basis for the second month in a row:
Mexico’s retail sales (MXWRTRYO) surprised analysts in March by contracting for a second straight month for the first time since 2009, bolstering bets policy makers will cut interest rates again this year.
Sales fell 2.4 percent from a year earlier, the national statistics agency said today, more than forecast by any of the 19 analysts surveyed by Bloomberg. The median estimate was for an increase of 0.3 percent. Retail sales climbed 0.25 percent from the previous month.
Also consider that recent fund flow data indicates that foreign investors are decreasing their inflows.
Other economic data in recent days have added to the worries. Foreign direct investment last year plunged to $12.7 billion, from an average of around $23 billion during the past decade, according to CEPAL, a UN-linked research organisation. It said the figure was affected by one-offs, such as a decision by Spain’s Banco Santander to list its Mexican subsidiary, raising $4 billion. That counted as an outflow of foreign investment. Some economists pointed to concerns that high levels of drug-related crime may also be taking a toll on investment, notably in tourism. Last year Mexico slipped out of the top ten of global tourist destinations.
As a result the Mexican market has sold off over the last week:
Technical support for the ETF was around the 70 level. Prices moved through that level last week in a convincing manner on large volume spikes. Support exists at various Fib levels; currently, the 61.8% Fib level from the June-April rally along with the middle Fib fan are supporting prices.
Yet the next day, 1Q GDP was issued, and the news was decidedly bearish:
Gross domestic product in the first three months of the year rose 0.8 percent from the year-ago period, less than the 1.1 percent median estimate in a Bloomberg survey of 18 economists. GDP grew 0.5 percent from the previous quarter, an annualized rate of 1.83 percent. The median estimate from seven analysts surveyed by Bloomberg was for a 0.3 percent gain.
The economy is growing at its slowest pace since GDP contracted 6.2 percent in 2009 in the aftermath of Lehman Brothers Holdings Inc.’s collapse. Today’s report showing industrial output is contracting increases the probability policy makers will cut rates as soon as July, said Gabriel Casillas, chief economist and head of research at Grupo Financiero Banorte SAB.
“It’s a very low growth figure and shows the economy is decelerating,” Casillas, who is based in Mexico City, said in a telephone interview. Mexico was hurt by “the slowdown in manufacturing of the U.S. that started in the fourth quarter of last year.”
And retail sales have contracted on a year over year basis for the second month in a row:
Mexico’s retail sales (MXWRTRYO) surprised analysts in March by contracting for a second straight month for the first time since 2009, bolstering bets policy makers will cut interest rates again this year.
Sales fell 2.4 percent from a year earlier, the national statistics agency said today, more than forecast by any of the 19 analysts surveyed by Bloomberg. The median estimate was for an increase of 0.3 percent. Retail sales climbed 0.25 percent from the previous month.
Also consider that recent fund flow data indicates that foreign investors are decreasing their inflows.
Other economic data in recent days have added to the worries. Foreign direct investment last year plunged to $12.7 billion, from an average of around $23 billion during the past decade, according to CEPAL, a UN-linked research organisation. It said the figure was affected by one-offs, such as a decision by Spain’s Banco Santander to list its Mexican subsidiary, raising $4 billion. That counted as an outflow of foreign investment. Some economists pointed to concerns that high levels of drug-related crime may also be taking a toll on investment, notably in tourism. Last year Mexico slipped out of the top ten of global tourist destinations.
As a result the Mexican market has sold off over the last week:
Technical support for the ETF was around the 70 level. Prices moved through that level last week in a convincing manner on large volume spikes. Support exists at various Fib levels; currently, the 61.8% Fib level from the June-April rally along with the middle Fib fan are supporting prices.
Thursday, May 16, 2013
Market Analysis: Mexico
From the FT:
Mexico’s lower house of Congress late Thursday gave overwhelming general approval to a telecoms bill that seeks to curb the power of some of the country’s most powerful businessmen.
The approval, by 414 votes to just 50 against, marks the first big step towards introducing more competition into telecoms and television as part of a wider push to make Latin America’s second-largest economy more competitive and grow faster.
In addition, they are also considering a banking reform bill:
Mexico’s centrist government announced it would send a financial reform bill to Congress that seeks to boost economic growth by making it easier and cheaper for companies to access credit.
This has led to an upgrade in Mexican debt:
The upgrade of Mexico’s sovereign ratings reflects its strong macroeconomic fundamentals, including the absence of macro-financial imbalances, consistent adherence to its inflation targeting and flexible exchange rate regimes, as well as the greater than anticipated commitment of the new administration and Congress to pass structural reforms. Moreover, the resilience of the economy is supported by the stabilization of oil production and progress in addressing drug-related violence, albeit it remains high.
All of the above news items are very positive for the country going forward. Let's take a look at some of the macro numbers
The current account is in good shape.
The annual growth rate has been consistent for the duration of the latest recovery
The government budget deficit is contained.
Inflation is running a little hot, but not at a fatal level.
And the unemployment rate is very low.
Let's turn to the Mexican ETF:
Resistance was strong in the 60-65 price area -- the pre-recession highs. However, prices have recently moved through that level.
Essentially, we see a rally from mid-June2012 to the Spring of 2013. Since the beginning of the year, prices have been meandering sideways, trading between the 70 and 76 level. Overall momentum has been weak, with the MACD nearing a "0" reading. The CMF tells us there's a net selling situation, albeit at small levels. All three of the shorter EMAs are trading in a very tight range, again giving us no sense of upcoming direction.
Overall, the daily chart is one of consolidation since the beginning of the year. As with any chart, pay particular attention to the price/200 day EMA relationship. Right now, it tells us we're still in a bull market.
Mexico’s lower house of Congress late Thursday gave overwhelming general approval to a telecoms bill that seeks to curb the power of some of the country’s most powerful businessmen.
The approval, by 414 votes to just 50 against, marks the first big step towards introducing more competition into telecoms and television as part of a wider push to make Latin America’s second-largest economy more competitive and grow faster.
In addition, they are also considering a banking reform bill:
Mexico’s centrist government announced it would send a financial reform bill to Congress that seeks to boost economic growth by making it easier and cheaper for companies to access credit.
Enrique Peña Nieto, the reform-minded president, has said that, together, the reforms would lift the annual growth rate in Mexico to as much as 6 per cent a year within five years from less than 4 per cent in 2012.
Flanked by opposition leaders, now a customary sight when announcing
an important reform, Mr Peña Nieto said the reform proposal was
“essential for the economy to grow more and to generate the jobs that
our population needs”.This has led to an upgrade in Mexican debt:
The upgrade of Mexico’s sovereign ratings reflects its strong macroeconomic fundamentals, including the absence of macro-financial imbalances, consistent adherence to its inflation targeting and flexible exchange rate regimes, as well as the greater than anticipated commitment of the new administration and Congress to pass structural reforms. Moreover, the resilience of the economy is supported by the stabilization of oil production and progress in addressing drug-related violence, albeit it remains high.
All of the above news items are very positive for the country going forward. Let's take a look at some of the macro numbers
The current account is in good shape.
The annual growth rate has been consistent for the duration of the latest recovery
The government budget deficit is contained.
Inflation is running a little hot, but not at a fatal level.
And the unemployment rate is very low.
Let's turn to the Mexican ETF:
Resistance was strong in the 60-65 price area -- the pre-recession highs. However, prices have recently moved through that level.
Essentially, we see a rally from mid-June2012 to the Spring of 2013. Since the beginning of the year, prices have been meandering sideways, trading between the 70 and 76 level. Overall momentum has been weak, with the MACD nearing a "0" reading. The CMF tells us there's a net selling situation, albeit at small levels. All three of the shorter EMAs are trading in a very tight range, again giving us no sense of upcoming direction.
Overall, the daily chart is one of consolidation since the beginning of the year. As with any chart, pay particular attention to the price/200 day EMA relationship. Right now, it tells us we're still in a bull market.
Wednesday, December 19, 2012
Mexico -- South Of the Border Growth Dynamo
Last week, I noted that Japan, UK and EU are all "zombie economies" -- economies that are for all practical purposes dead in the water right now. However, other regions of the world are doing very well -- especially those south of the border. While Mexico does have some serious problems (the drug war and over 25,000 dead come to mind, along with systemic corruption), the overall economy has actually done very well since the end of the great recession. Consider the following data points from the Central Bank's latest Inflation Report:
Overall GDP has grown strongly. The chart on the right indicates that the quarterly percent change has been positive since 2009 and has been in the .75-1.5% range. The chart on the right shows that the annual rate of change has been positive as well -- 4% appears to be a good average to use for the last few years.
The left chart shows ANTAD sales (retailer's association) have been rising strongly over the last five years. Also note these moved sideways during the recession. The right side also shows retail and wholesale sales, both of which have risen since their recession lows and both of which are now above their pre-recession peaks.
A reason for the increase in consumption is the strong growth of wages. The left charts shows that wages have been growing in the 4% range for the last few years. The right chart shows that consumer confidence -- which although below pre-recession levels has been rising for the last few years. Finally, we see that remittances from the US are actually down.
Investment has also been very strong. The left chart shows that overall investment (black line) has been rising consistently since the recession and is now above pre-recession levels. It has risen because of incredibly strong machinery and equipment investment (red line) and overall construction. Machinery investment has increased as a result of both domestic and imported machinery (middle chart). Finally, overall confidence for producers is strong.
The left chart shows that total activity has been strong for the industrial and service sectors, while the middle chart shows that manufacturing has been strong -- even without a bump from auto production (the red line). Finally, total vehicle production (left char) is still very strong.
Finally, notice that the economy has adequate funding from both foreign and domestic sources.
The bottom line is that -- despite the above mentioned problems -- the overall Mexican economy is doing very well, especially compared with the rest of the world.
Overall GDP has grown strongly. The chart on the right indicates that the quarterly percent change has been positive since 2009 and has been in the .75-1.5% range. The chart on the right shows that the annual rate of change has been positive as well -- 4% appears to be a good average to use for the last few years.
The left chart shows ANTAD sales (retailer's association) have been rising strongly over the last five years. Also note these moved sideways during the recession. The right side also shows retail and wholesale sales, both of which have risen since their recession lows and both of which are now above their pre-recession peaks.
A reason for the increase in consumption is the strong growth of wages. The left charts shows that wages have been growing in the 4% range for the last few years. The right chart shows that consumer confidence -- which although below pre-recession levels has been rising for the last few years. Finally, we see that remittances from the US are actually down.
Investment has also been very strong. The left chart shows that overall investment (black line) has been rising consistently since the recession and is now above pre-recession levels. It has risen because of incredibly strong machinery and equipment investment (red line) and overall construction. Machinery investment has increased as a result of both domestic and imported machinery (middle chart). Finally, overall confidence for producers is strong.
The left chart shows that total activity has been strong for the industrial and service sectors, while the middle chart shows that manufacturing has been strong -- even without a bump from auto production (the red line). Finally, total vehicle production (left char) is still very strong.
Finally, notice that the economy has adequate funding from both foreign and domestic sources.
The bottom line is that -- despite the above mentioned problems -- the overall Mexican economy is doing very well, especially compared with the rest of the world.
Subscribe to:
Posts (Atom)