- by New Deal democrat
A recession is generally defined by the NBER as a substantial downturn in production, employment, sales, and income. Now that the November numbers are in, let's take a last look for where those numbers stand in 2012.
The St. Louis FRED site directs us to nonfarm payrolls, real personal income excluding transfer payments, industrial production, and real retail sales as defining metrics. Here's how those stand, normed to 100 as of July 2012:
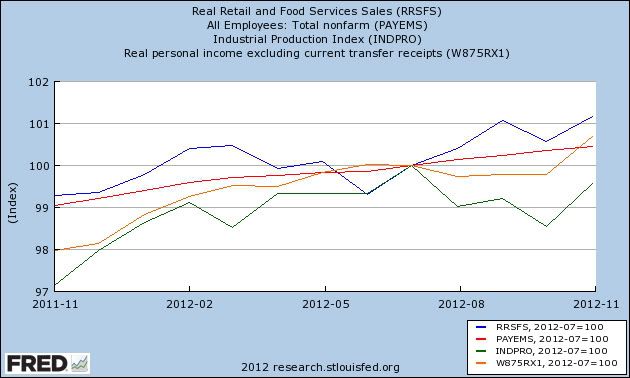
As of now, 3 of the 4 metrics are still rising. Only industrial production has contracted since that time.
Another metric that is thought to be looked at by at least a few members of the NBER is aggregate hours, which measures the total hours worked in the economy. During the recession of 2008-09, about 6% of alll jobs were lost, but 10% of all hours worked. The deficit in hours worked was made up at the beginning of 2012, and the two have moved largely in tandem since:
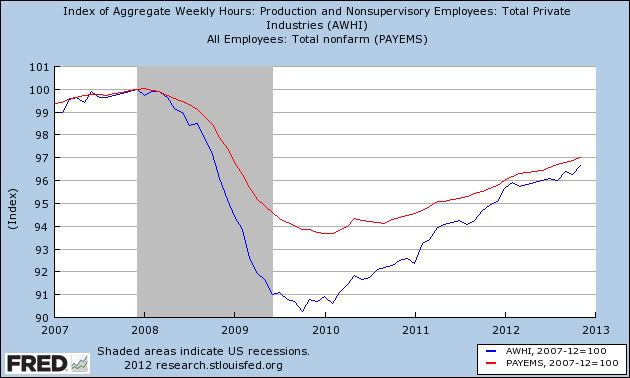
So aggregate hours have also continued to increase.
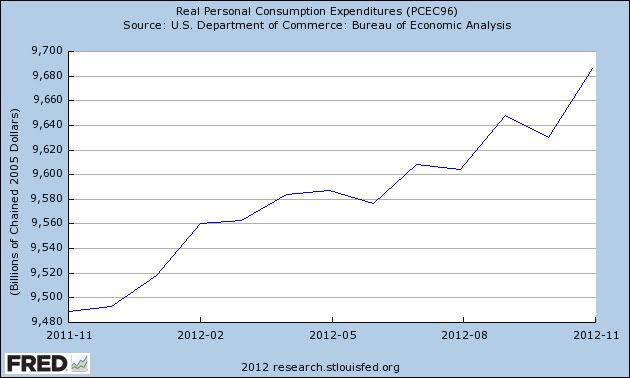
In addition to real retail sales, another way of measuring sales is via real personal consumption expenditures, which also have continued to increase:
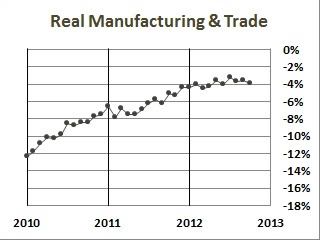
The preferred sales metrial cited by ECRI is real manufacturing and trade sales. This series isn't tracked by the St. Louis FRED, but blogger Doug Short has been measuring this recently to track ECRI's prediction, and here's his graph:
My conclusion is that, by most measures, the expansion has continued through November. Nevertheless it is clear that, no matter how you measure, the economy slowed markedly by March and has not picked up momentum since.