Tuesday, June 7, 2011

Wednesday Commodity Round-Up


This week I want to look at the copper chart. As I mentioned before, copper has a strong correlation with the overall stock market.

Right now, the copper market is in an up/down/up sell off, making a series of lower lows and higher highs. Prices have sold-off in three, well-disciplined channels. This is encouraging as it tells us that traders are not running for the hills, but slowing getting out of positions. While the shorter term trend (the 10 and 20 day EMA) is up, the shorter EMAs are below the longer EMA. Additionally, the longer-term trend is down and prices are using the EMAs as resistance rather than support. However, the MACD is moving higher.

Right now, Dr. Copper is signaling further weakness.

Wherein I Agree With the WSJ; Or More Evidence of the Washington Lobotomy Factory

The Diamond withdrawal is a pure political travesty. Just to reiterate the basic points:

1.) Peter Diamond won the Noble Prize in economics for his work on unemployment
2.) He was rejected by the Senate Republicans because of his probable support for QEII

Here is the main thrust of the Journal's argument:

Shelby, among other things, stated Diamond supports QE2, the about-to-be-completed second round of so-called Fed quantitative easing. Guess who also supports it, in fact came up with it and implemented the QE2 policy: Bernanke and company.

The claims about Diamond not being qualified don’t hold up well. Shelby has rhetorically asked whether Diamond has experience in conducting monetary policy. Who does before they actually get to help conduct monetary policy? Other credential-based objections seem surmountable.

So, should a nominee not get to serve on the Fed because his views appear in line with the administration that nominated him and the majority of serving Fed policy makers? Seems like a dubious, if current, notion.

The primary problem the economy currently faces is high unemployment. Maybe actually listening to people who have studied the problem -- and gotten really important awards for it -- is a good idea. I'm reminded of the scene in the movie Armageddon where they are talking about how to deal with the "planet killer asteroid," and the general rejects what the NASA scientist says. Billy Bob Thornton interjects, "This is Dr. So and So. He's the smartest guy on the planet. You probably want to listen to him." I'm deeply concerned that we're now at a point where we reject very qualified candidates because they might have a view of reality that is different from ours. That is a sign of intellectual immaturity of the highest order.

Diamond's non-confirmation is a tragedy and shows just how incredibly stupid Washington has become.

Mileading sensationalism about current unemployment vs. Great Depression

- by New Deal democrat

Yesterday CBS news published an article with the sensationalist headline: "Chronic unemployment worse than Great Depression" that has been getting prominent play in all of the usual places.

It's a classic case of there being three types of lies: Lies, Damned Lies, and Statistics.

The subtitle to the CBS articles is
The unemployed have, on average, remained unemployed longer than in the 1930s
and the text of the article gives the actual data:

About 6.2 million Americans, 45.1 percent of all unemployed workers in this country, have been jobless for more than six months - a higher percentage than during the Great Depression.
In other words, it's statistic isn't the number of people who are long term unemployed, it's the percentage.

Fortunately, a commenter named rerutled has already done the heavy lifting for me:

Wait a second here: what the article says is that 45% of the unemployed (themselves, 9%) are long-term unemployed; and that the 45% is higher than during the great Depression.

Unless the 9% unemployed is also greater than during the Great Depression, that's not a "this is worse than the Great Depression" equivalence. What's really relevant is the % of the total workforce that is long-term unemployed.

I mean: what if the unemployment rate were 3%, but 100% of that were long-term unemployed? According to that article, we should say "this is worse than the Great Depression", which, of course, is nonsense.

Watch it, when someone quotes percentages of percentages to you.
Exactly.

Suppose you were in a hospital, bleeding from a severed artery. The doctors and nurses staunch most of the bleeding, but you are still losing a little blood.

Compare that with a situation where the bleeding hasn't been staunched at all, and you are continuing to hemorrhage unabatedly.

In the first case, most of your blood loss is "chronic" - it's old, but the blood is still lost. In the second case, it isn't, because the "old" blood loss is less of the current total.

Which situation would you rather be in?

The current unemployment situation is bad, but the discourse is not helped in the slightest by misleading headlines with statistics contorted so that the phrase "worse than the Great Depression" can be used.

Why Was Last Month's Employment Report Bad?

So -- why did the economy only produce 54,000 jobs last month? First, let's put the number into context:
We have to remember that this is just one month - even if the numbers were dismal. So far the economy has added 908,000 private sector jobs this year, or about 181 thousand per month. There have been 783,000 total non-farm jobs added this year or 157 thousand per month.
The unemployment rate is still unacceptably high and there is painfully little attention being paid to this problem from the position of policy makers. However, the overall trend is still decent, save for one month of data. However, back to the question: why the one month drop?

1.) Japan: Motor vehicle parts employment lost 3,400 jobs last month. Japan is responsible for a large amount of motor vehicle production, meaning the after-effects of the earthquake are still hurting.

2.) Gas prices specifically and commodity prices generally. All of the regional Fed manufacturing reports and the latest ISM manufacturing report are littered with information indicating high commodity prices are starting to hurt. Remember that manufacturing now uses the "just in time" method of parts delivery, meaning that high fuel costs really hurt production and add to costs. As such, high gas prices really hurt the bottom line.

3.) We're in another period of economic uncertainty: in the EU, Greek concerns are again taking center stage. In the US, we have the budget issue in Washington. Now we have ratings agencies threatening to downgrade UIS debt (or, they're starting to think about downgrading US debt). Either way, this level of uncertainty freezes action.

4.) Depressed consumer sentiment: consider the following chart of the University of Michigan's Consumer Sentiment Index:

Consumer sentiment is already at low levels. The latest drop is seen more clearly in the following chart:


The drop a few months ago -- and the lack of any climb from that drop -- indicates consumers are not happy. And when that happens, they stop spending. We're already seeing signs of this in the latest GDP revisions and retail sales report. Decreasing sentiment means lower demand, which leads to businesses cutting back on production which leads to lower hiring numbers.

Monday, June 6, 2011

Treasury Tuesdays

Last week, I wrote the following about the Treasury market:
I would still be long Treasuries right now. There is little reason to think the Fed will raise rates anytime soon. The economy is slowing down, which will probably decrease inflationary pressures. There is still concern about the EU situation, making safer asset more attractive. Also adding to the attraction is the lack of upward movement in the stock market and decrease in commodities. I would still use 2.75% on the 10 year as a line to look for (a commenter asked why I chose that number. The answer is it's a round number that the bond market likes).
As I pointed out in yesterday's market recap, last week's economic news was decidedly negative. As such, Treasuries are still an attractive investment.

Consider the following chart:


The IEFS are still in a clear uptrend. Prices have a firm trend in place, all the EMAs are moving higher and the shorter EMAs are above the longer EMAs. The A/D and CMF confirm that more money is flowing into the market and the MACD indicates that momentum is clearly in our favor, although decreasing a bit.


In contrast, the TLTs are looking a bit weaker. Prices have broken their upward sloping trendline, and prices are using the EMAs for technical support. While the A/D and CMF are showing money moving into the market, the MACD has given a clear sell signal, indicating the rally at the end of the curve may be hitting some choppy water.

Overall, I'd take profits in TLTs if you made the trade, but I'd still keep in the IEFs; there is no sign they are going to be ending their rally soon. In addition, there is still concern about a weakening economy.

The Washington Lobotomy Factory Moves into High Gear

From Bloomberg:

Nobel laureate Peter Diamond, nominated three times by President Barack Obama to serve on the Federal Reserve’s board of governors, will ask the White House to withdraw his nomination in the face of Republican opposition.

Diamond announced he won’t seek the position in an opinion article posted yesterday on the New York Times website, saying his opponents failed to appreciate that analysis of unemployment is essential to effective monetary policy. A Massachusetts Institute of Technology professor, Diamond won the Nobel Prize in economics in October for his work on the labor market.

“The Republicans on the committee voted in lockstep against my appointment, making it extremely unlikely that the opposition to a full Senate vote can be overcome,” Diamond said. “It is time for me to withdraw, as I plan to inform the White House.”

The withdrawal ends a 14-month nomination effort resisted by Senator Richard Shelby of Alabama, the senior Republican on the Senate Banking Committee, who with party colleagues repeatedly criticized Diamond for supporting the central bank’s record monetary stimulus.

Shelby and the other nine Republicans on the banking panel voted last month against the advance of Diamond’s nomination to the full Senate, while the 12 Democrats backed Diamond for the post.

“It is my hope that President Obama will now nominate someone capable of garnering bipartisan support in the Senate,” Shelby said yesterday in a statement. “It would be my hope that the President will not seek to pack the Fed with those who will use the institution to finance his profligate spending and agenda.”

His NY Times editorial is here.

The man won a Noble Prize for a paper that studies unemployment -- not that it's a major issue right now or anything. The Noble Prize means he's really smart -- he's probably forgotten more about econ than Shelby or his cohorts ever knew.

This is pure, partisan garbage, plain and simple. There is no reason for this. It is another example of the abject stupidity of Washington.

And an inside joke to NDD -- I couldn't get 24 hours.


The need for wage-improving, Demand-Side Economics

- by New Deal democrat

From Bonddad: This is, without a doubt, one of the best pieces NDD has ever written. I agree 100% with his conclusions on the topic. While I'll be posting on this topic something later this week, NDD has provided a far more thorough and well-researched article.

There has been a secular shift in the American economy going back at least 4 years. The self-congratulatory "great moderation" was really the reflection of wage stagnation for the majority of Americans being masked by increased household debt loads, and the ability to carry those increased debt loads due to the ability to refinance them at lower and lower interest rates.

This secular shift is a phenomenon I first wrote about at great length in 2007, asking Are Hard Times Near? That pessimistic prediction has been answered in a thunderclap-like affirmative ever since. I have returned to this issue several times during the last four years, writing last year under similar circumstances to our present slowdown that wage stagnation was the greatest threat to the recovery.

Simply put, when there is only 1-2% wage growth per year, any inflationary spike - even a 3% spike due to energy increases - is enough to cause the economy to stall. There can be no long-term, sustained recovery for the large majority of Americans unless there is real, long-term wage growth. Thus, while at one level the current slowdown or stall is the result of an energy price shock, on another level it was predictable (and predicted by others and me) due to prices faced by consumers rising faster than their disposable incomes.

In summary, American consumers:
* have not had an increase in household wealth
* have been unable to refinance at lower interest rates for more than 3 years
* have been unable to tap into increased wealth via stock or house price appreciation above previous levels
* and have chosen instead to cut back significantly on debt (more than 1/2%)

only three times in the last 31 years: during the recessions of 1981-2, 1990-1, and the "great recession" of 2008-09.

This result can be easily seen by showing real, inflation-adjusted YoY hourly wages, and also the effect of declining vs. stalling interest rates.

Before looking at the graphs showing those long-term trends up until now, first let me show you what I said back in August 2007 on the cusp of the "great recession":
The American consumer has had largely stagnant wages since 1974.... [F]rom 1980 through 2006, the median income of an American household has risen only from $39,700 to $48,200 in real terms .... Consumers have responded generally by taking on more and more debt. Total household debt service has risen from 16% in 1980 to 19.4% in 2006.
Fortunately for consumers, there has been a generation-long decline in interest rates since they peaked at 15.21% for the 30 year US Treasury bond in October 1981. This has allowed consumers to refinance their debts at ever lower rates every few years. They have also been assisted by a bull market in stocks that took the S & P 500 from 102 in 1982 to 1553 in 2000, and the subsequent housing boom/bubble.

There are signs that this "Great Disinflation" of declining interest rates is coming to an end. Only twice in the last 27 years has the consumer been unable to refinance debt or tap into his or her stock or house ATM.... [T]he 3rd and final time is almost certainly near.

.... If consumers are unable to tap the value of assets, or to refinance, then without improvements in wages, they will pull back and cause a consumer-led recession. Since 1980, this has only happened twice: in the deep Reagan recession of 1981-82, and again briefly from July 1990 to March 1991.
.... [T]he failure of interest rates to make new lows signifies that any continued deterioration in house prices, or significant and sustained decrease in stock prices, will likely give rise to an imminent recession danger sign.
The YoY% change in real, inflation adjusted hourly earnings for the last 30 years is shown in this graph:


With the exception of the late 1990's tech boom, and those times in the last 10 years when energy prices briefly reversed, real hourly income has made no progress at all. The 1981-82, 1990, and 2008-09 recessions have all been accompanied by declines in real hourly income.

Now, let's show how mortgage rates have behaved since peaking in the early 1980's:


Notice that there has been a general 30 year long decline in rates, punctuated by stagnant rates in the late 1980s, most of the 1990s, and the housing bubble era.

Here is a slighly different look, showing the year-over-year change in mortgage rates:


Now, let's put the two series together, showing real YoY% wage changes in blue, and YoY changes in mortgage rates in red:


This graph shows that stagnant or rising mortgage rates occurred at the same time as stagnant or declining real incomes (generally, when the red line is higher than the blue line in the graph above) during mid-cycle slowdowns at on the eve of or start of the post-1980 recessions. This was true by the end of 2007, it was true in last summer, and it has been true for the last few months.

Thus, only one month after the story quoted above, in September 2007, with new data showing that households were beginning to shun debt, it seemed clear that under the above criteria, consumers were signalling recession:
In order to avoid a recession, house price declines must stop, stock market gains must accelerate, or household income must increase significantly. Failing at least one these three things, if households have continued to cut back on debt, as appears likely, America will probably enter (or may already have entered) only its 3rd consumer recession since 1980.
This was the final shoe to drop. Household debt deleveraging in the face of stagnant wages and the inability to refinance has been the harbinger of all post-1980 recessions. Here is how household deleveraging stands as of the last report (4Q 2010):


I revisited the issue of real wage growth as a necessity for sustained economic growth in May 2009 even as I foresaw the bottoming of the recession:
the indicators studied from the Deflationary period of 1920-1950 suggest that the GDP might stop contracting in about Q3 2009, and start to actually grow.

But then what?

Whether the bottom of the trough of this decline in economic activity is in a few months, or if it is a year or two or more away, the fact remains that, with anemic wage growth to say the least, any incipient recovery ... would be short lived, strangled by the inflation caused by its own increase in demand. If the inflation rate agains exceeds wage growth, consumers will simply cut back again, plunging the economy into another leg down of a "W"-shaped recession.

.... In summary, from here on ... we're not going to see any sustained recovery in the American economy until average Americans see a real and sustained increase in their compensation for labor -- for the first time in over 35 years.

But there is still one more chance ... [i]f long term interest rates do decline again, consumers may yet have one more chance to refinance their spending for the next few years.

.... While if lower mortgage rates persist, there will be space for an economic breather, the paradigm of my 2007 piece remains true. So long as real wages remain stagnant, any recovery which might start will be vulnerable to every uptick in inflation and interest rates, and will be shallow, weak, and probably short-lived. The Great Disinflation of Interest Rates is Ending, the long-term structural problems of our economy have become immediate problems as well, and no long-term recovery is going to take root without real wage growth.
Luckily, as shown in the first graph of 30 year mortgages shown above, consumers did indeed get yet one more chance to refinance in 2010. But the problem with stagnating real wages surfaced again during the summer slowdown last year:
[T]he economic recovery is in a very tight spot -- precisely because average American consumers also remain in a very tight spot. [There has been] wage growth of about 1.5% for the last year. Under those circumstances, even 2% inflation is too much for them to withstand -- without the ability to refinance debt, their disposable income simply isn't keeping up....

So with paltry income increases of about 1.5%, there are only two ways to sustain the recovery for very long: (1) the inflation rate remains in a very narrow window of 0-1.5%; (2) some asset held widely by average consumers appreciates in value. or (3) another opportunity arises to refinance mortgage debt.

I thik we can all agree that number (2) doesn't look like it's going to happen. That leaves either number (1) or number (3).

....The price of Oil in particular will determine if inflation can remain in the "sweet spot" necessary given low wage growth

.... [O]nly a very narrow window of inflation is helpful to the recovery, and if the unlikely event of decent wage increases doesn't happen, that kind of extremely tame inflation is dependent most of all on energy prices....

This is a very small needle to thread - so the biggest danger to sustaining the recovery.
I have quoted my earlier material at length to show you that this isn't some new theory. I've been writing about it since before the "great recession" and indeed predicted both the beginning and bottom of the recession in large part based on this paradigm. It has proven itself empirically in the real world.

When interest rates fall to new lows, consumers respond aggressively by refinancing debt, freeing up more spending power. When that isn't available, and when households can't cash in on rising asset prices (e.g.,houses or stocks) even inflation of only 2% can be enough in the face of stagnant real wages to choke off any real increase in consumer spending and the economy stalls - or worse.

Aside from the need to prevent repeated energy price shocks throwing the country into recessions, among the most pressing priorities is the need to replace "supply side" economics with "demand side" economics that tilt the scales in favor of real, sustained wage increases for average Americans. Without that, there can be no long-term strong recovery or expansion.

Sunday, June 5, 2011

Equity Week in Review and Preview of the Upcoming Week/Month

Last week, I wrote the following about the market:

The good news in these charts is we are not seeing a massive sell-off; instead the selling is disciplined and meandering. I believe traders are treating the current economic slowdown with a "wait and see" attitude. However, as the sell-off continues, keep your eye on important technical levels as they might indicate a good shorting opportunity. I would not be long right now.
Last week's economic news was terrible: manufacturing dropped hard, the case shiller house price index declined, consumer confidence dropped, initial unemployment claims are still stubbornly high and the unemployment rate increased. In short, there is no reason for people to be long right now. Hence, we get the following 5-minute chart:


The market was closed on Monday and tread water on Tuesday. Prices dropped hard on Wednesday, moved sideways on Thursday, and gapped lower at the open on Friday and sold-off into the close. This is not a bullish chart.


Prices are now below key support levels and have broken through the lower support line of a downward sloping channel. The 10 day EMA has crossed below the 50, and the 20 is about to cross below the 50. The shorter EMS are moving lower.


On the longer chart, prices have clearly broken long-term support.


The QQQs have also broken long-term support and are below key support levels.


The IWMs have also broken key, long-term support and are right at key shorter support levels.

All of the major averages have now broken long-term support lines and the economic news is decidedly negative. I would be looking for shorting opportunities with a price target of the 200 day EMA.

Friday, June 3, 2011

Weekly Indicators: free falling is fun, it's the SPLAT! that hurts Edition

- by New Deal democrat

All things considered, I'd rather have been wrong yesterday when I said that the jobs consensus was wrong, and to expect only a +50,000 nonfarm payrolls report. With the exception of the ISM services report, virtually every other report this week - ISM manufacturing, concumser confidence, construction spending, factory orders - hit an air pocket. Vendor supplies in the ISM (a leading indicator) will subtract about -.3 from that report. The manufacturing workweek (another component of the LEI) remained flat, and the household survey showed +105,000 jobs, reversing most of last month's loss, which for this week counts as a silver lining.

Turning to the high-frequency weekly indicators:

Oil remained stubbornly above $100 a barrel late Friday. It still remains slightly above 4% of GDP. Gas at the pump fell for the second week in a row, declining $.06 more to $3.79 a gallon. Gasoline usage at 9431 M gallons was 2.8% higher than last year's 9174. This is the first positive YoY comparison in almost three months.

The 
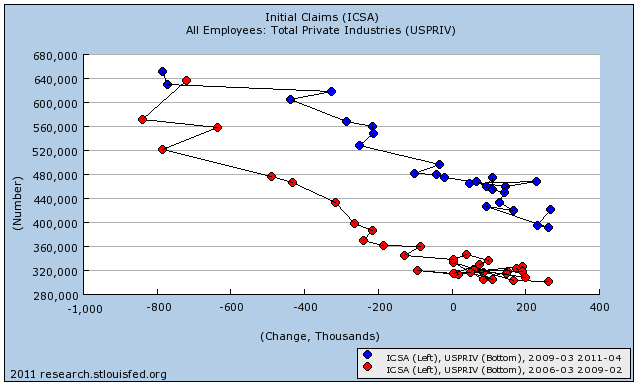
BLS reported that Initial jobless claims last week were 422,000. The four week average declined to 425,500. We are back at levels last seen late last autumn - but still significantly lower than the rest of last year - and likewise considerably higher from earlier this year.

Railfax was up 2.3% YoY for the week, or 17,600 carloads. The Baseline traffic 4 week moving average is virtually flat, up only 0.07% from a year ago. Cyclical traffic is up 4.25%. Intermodal traffic (a proxy for imports and exports) is 6.42% compared with a year ago.

The Mortgage Bankers' Association reported that seasonally adjusted mortgage applications were flat last week. It was 7.6% higher than this week last year. The purchase series has now been generally flat for over a year, and this is the second week in a row that YoY comparisons in purchase mortgages were positive. Except for the rush at the two deadlines for the $8000 mortgage credit, these are the first YoY increases since 2007. Refinancing decreased 5.7% despite a continued decline in mortgage rates.

The American Staffing Association Index remained at 94 for the third week. This advance continues to look very much like the first half of 2007 - slow growth, but not stalled.

The ICSC reported that same store sales for the week of May 28 increased 2.8% YoY, and increased 0.4% week over week. Shoppertrak reported a very strong 6.0% YoY increase for the week ending May 28 (the third strong week in a row) and a WoW increase of 3.0%. Weekly retail sales numbers have been a bright spot all year, generally showing the consumer not rolling over due to gas prices.

Weekly BAA commercial bond rates decreased another .02% to 5.74%. This yields of 10 year treasury bond decreased .05% to 3.10%. The recent decline in treasury rates do show fear of deflation, and corporate rates have not declined so much, showing a slight increase in relative distress in the corporate market.

Adjusting +1.07% due to the 2011 tax compromise, the Daily Treasury Statement showed that for May 2011, $140.1 B was collected vs. $126.8 B a year ago, for an increase of 11.7% YoY. For the last 20 days, $113.7 B was collected vs. $126.7 B a year ago, for an decrease of $11.8 B, or -0.9%. Use this series with extra caution because the adjustment for the withholding tax compromise is only a best guess, and may be significantly incorrect. Last May was weak and had one fewer workday, so the monthly comparison isn't as great as it looks, and the last 20 days look abysmal.

M1 was up 0.9% w/w, up 1.5% m/m, and up 13.1% YoY, so Real M1 was up 10.1%.
M2 was up 0.1% w/w, up 0.6% m/m, and up 5.1% YoY, so Real M2 was up 2.0%.
Real M1 remains very bullish, while Real M2 remains stuck in the caution zone under 2.5%

Finally, since there is heightened scrutiny of the decline in housing prices recently, this week I am starting to report the weekly update of median asking house prices from over 50 metropolitan areas at Housing Tracker. While a weighted mean would be the most accurate measure, the author of the site does not track that way. Thus I will report the YoY% median change for the areas, plus how many of the YoY% changes are positive, and how many show double-digit declines. I am very confident that when housing prices do bottom, this measure will be the first to show it, and in real time, just as it showed the peak in real time in 2006. This week the median YoY decline is -5.7%. Ten areas showed double-digit YoY% declines and 4 showed YoY% increases in price.

The slowdown is here, the stall is tapping on our shoulders, and the Doomers are close behind murmuring darkly about "green shoots" again. Their perfect record will probably remain intact. Please recuperate safely with the beverage or other vice of your choice this weekend!

Payrolls +54,000; Unemployment to 9.1%

From Bloomberg:

U.S. employers in May added the fewest number of workers in eight months and unemployment unexpectedly rose to 9.1 percent, underscoring Federal Reserve concerns the expansion is failing to boost the labor market.

Payrolls increased by a less-than-projected 54,000 last month, after a revised 232,000 gain in April that was smaller than initially estimated, Labor Department figures showed today in Washington. The median forecast in a Bloomberg News survey called for payrolls to rise 165,000. The jobless rate climbed to the highest level this year from 9 percent a month earlier.

.....

Factories cut payrolls in May for the first time in seven months, partly reflecting a drop at motor vehicles and parts producers that may have been related to a components shortage after the earthquake in Japan. Employment at retailers, leisure and hospitality companies and state and local governments also decreased during the month.

.....

Average hourly earnings rose to $22.98 from $22.92 in the prior month, today’s report showed. The average work week for all workers held at 34.4 hours.

There is not much to like in the report, save for the fact that it's one month of bad data. The underlying details -- the drop in manufacturing and construction -- point to the overall manufacturing slowdown we've seen over the last 1-2 months. There are also signs that a Japan related hit is occurring. In addition, I'm thinking that higher fuel prices are leading companies to become more cautious as their respective bottom line takes an energy related hit. High fuel prices also dented the retail employment numbers as consumers cut back on their purchases of non-essential items.

On a scale of 1-10, I'd give this a 2.5, maybe less. The only good thing is it's only one month of data.


Thursday, June 2, 2011

Friday Dollar Analysis

Last week, I wrote the following about the dollar
While prices have moved above the 50 day EMA and the shorter EMAs are moving higher, I am skeptical of the dollar making a big move up at this point. GDP reprinted at the 1.8% level -- which is pretty weak -- and there is little reason the Fed will raise rates anytime soon. I would only be a buyer if prices moved above the longer term moving average. If prices move below the EMAs, I'd wait for a rebound into the EMAs before shorting.
Let's take a look at the chart:


Prices hit resistance and started to move lower. Also note the EMA picture: all are moving lower, the 10 and 20 are below the 50 and the 10 is about to move below the 20. Prices are also below the EMAs.

This week, we learned that the macro picture for the US economy is weakening as well -- the ISM number dropped, Case Shiller moved lower and initial claims are still above 400,000. There is little reason to see the Fed raising rates anytime soon, meaning the interest rate play won't exist for the dollar. In addition, the weakening economy means the dollar will lose its attractiveness as an investment.

I'd wait for a price rebound into an EMA, and then short.

ISM Gets Significant Whack

From the ISMLink
The report was issued today by Bradley J. Holcomb, CPSM, CPSD, chair of the Institute for Supply Management™ Manufacturing Business Survey Committee. "The PMI registered 53.5 percent and indicates expansion in the manufacturing sector for the 22nd consecutive month. This month's index, however, registered 6.9 percentage points below the April reading of 60.4 percent, and is the first reading below 60 percent for 2011, as well as the lowest PMI reported for the past 12 months. Slower growth in new orders and production are the primary contributors to this month's lower PMI reading. Manufacturing employment continues to show good momentum for the year, as the Employment Index registered 58.2 percent, which is 4.5 percentage points lower than the 62.7 percent reported in April. Manufacturers continue to experience significant cost pressures from commodities and other inputs."
Here's a chart from Bloomberg:


That's a big whack, an indicates the slowdown is real, confirmed, and pretty big.

The rest of the report is actually pretty good. 14 of 18 industries are expanding, and most of the "what participants are saying" focus on rising prices, indicating strong demand. The main problem with this report is the size of the drop in the macro number and its various components, which indicates a fairly strong, abrupt slowdown is occurring.

Deficit Reduction Math

Over at the Streetlight, Kash demonstrates that cutting spending is not always a bright idea.

Read the whole thing.

Expect a poor nonfarm payrolls report tomorrow

- by New Deal democrat

As I type this, the consensus is still for a payrolls gain of about +150,000 tomorrow. Based on the poor performance of initial jobless claims in the last month, I am expecting a considerably poorer report, on the order of only +50,000. I base this on the difference between how payrolls behave in the face of rising initial jobless claims vs. falling claims.

Below is an update of my scatter graph comparing initial jobless claims vs. nonfarm payrolls that I first ran several weeks ago. I included the deterioration in jobs leading up to and into the recession in red. Note how the red line traces a very different path than that of the recovery:


This is why I dismissed the straight line Prof. Delong drew at 400,000 jobs as the dividing point between job growth vs. losses. It simply makes a world of difference whether you are deteriorating into recession, or in recovery coming out of recession, leading to very different scatterplots as above (the same pattern is true for every other postwar recession).

But how should we expect jobs to behave in the face of seriously climbing initial claims? We only have one true example, of a double-dip, and that is the failed 1980 recovery turning into the 1981-82 recession. Here is the scatter graph for that double dip, showing the abortive recovery (blue) and the double-dip (red):


Even with the "summer stall" last year, where GDP only fell to +1.7%, nonfarm payrolls fell into and remained in 5-digit territory. Hence my expectation for tomorrow is that nonfarm payrolls retreat into 5 digits.

If that happens, watch Oil and see if it falls to a new post-April low. Only the real fear of a double-dip will cause the chokehold to loosen.

Quick Update on the Equity Markets


On Monday, I wrote the following:

The good news in these charts is we are not seeing a massive sell-off; instead the selling is disciplined and meandering. I believe traders are treating the current economic slowdown with a "wait and see" attitude. However, as the sell-off continues, keep your eye on important technical levels as they might indicate a good shorting opportunity. I would not be long right now.


Given yesterdays price action, I'd keep your eyes open. Below are the longer charts of the major ETFs and crucial, short-term support areas to keep in mind. But remember -- keep an eye on the fundamental situation as well. Yesterday's sell-off was caused by the culmination of several weeks of weakening manufacturing news. Friday's employment report will be key. With all of these charts, I'd be using the 200 day EMA as a price target


Thursday Oil Market Analysis

Last week I wrote the following about the oil market:
While I gave 96 as a shorting level least week, this week I would make it the 200 day EMA. In addition, I would still wait until prices moved about the 104 price level as this would get them above technical resistance and through the EMAs.
Little has occurred this week to change that opinion.


The 5-minute chart shows that prices have been moving between roughly 99 and 103. In addition, the 104 level still appears to be providing upside resistance to prices, as evidenced by yesterday's drop.

On the daily chart, I've added two areas at roughly the 96 and 104 level to show where support and resistance are. Prices have not moved beyond eight area in any meaningful way. Also note the 50 day EMA is still providing upside resistance for prices.

The oil market is still trying to figure out a direction. On the upside, we are moving into the summer driving season, which is typically a period of rising oil prices. However, with retail gas prices still near $4/gallon and the economy slowing, traders are also aware that gas can't go much higher without killing US demand. At the same time, developing markets are providing a demand floor; as their respective middle classes have grown, so has their respective oil demand. As such, there is little reason to see a significant price decline -- hence, the reason I thing 96 will provide support going froward.

Wednesday, June 1, 2011

Chicago PMI Drops But Still Positive

From Bloomberg:
A big slowdown for month-to-month growth in new orders helped pull down the Chicago PMI by 11 points in May to 56.6 to indicate the slowest rate of monthly growth since November 2009. New orders fell nearly 13 points to 53.5, still over 50 to indicate an increase compared to April but the weakest reading since September 2009. Growth in backlog orders almost entirely evaporated while inventories surged which may suddenly may indicate an unwanted build tied to slowing activity. Delays in deliveries shortened, which is also consistent with general slowing, while production, at 56.0, is still strong but well down from a run of 70 readings. Prices for raw material inputs, at 78.6 and in contrast to most of the readings, did not slow very much. A plus in the report is a comparatively mild slowing in employment, down nearly three points to a still strong 60.8 to indicate solid month-to-month growth in total payrolls as this report includes all areas of the economy. Markets are showing no significant reaction to the report.
Let's look at the data from the report:


Click for a larger image

Notice the drop across the board in the major categories -- production, new orders and order backlogs. While the overall number is still positive, the internals are very concerning. Not only do they confirm the slowdown we've seen, but also indicate the need to be very watchful of the manufacturing numbers going forward.

Oil Prices and the Recovery (revisited)

- by New Deal democrat

I've been writing about this topic for well over a year, and here we are again.

Reading the punditry is an excellent exercise in watching cognitive psychology at work. If you are a gold-bug like Mish, then the slowdown is about money printing. The Fed must be abolished and the gold standard re-adopted. If you are the Calafia Beach Pundit (Scott Grannis), then the slowdown is about the failure of Keynesian stimulus. To the contrary, if you are Paul Krugman, then the slowdown is about the inadequacy of the stimulus. And if you are Robert Reich, it is about failure to put spending power in the hands of ordinary Americans.

In short, the slowdown is like a Rohrshach blot onto which pre-existing worldviews are projected.

It ought to be clear that my political sympathies are with Krugman and Reich, but I'm not sure we need a particularly sophisticated explanation for the slowdown. Making use of Occam's razor, we can simply say that it is all about Oil prices. Here is a graph for the last 6 years of inflation-adjusted Oil prices where January 2010 prices = 1, where Oil analyst Steve Kopits' metric of Oil at 4% of GDP = $90 (blue). Real GDP growth is in red (*25 to make use of the same scale):


Over that time period, simply knowing the "real" price of Oil has been an excellent forecasting tool for GDP in the same or next quarter. (You may recall that Prof. James Hamilton found that his energy price shock model explained about half of the decline in the great recession).

As to other suggested contributing factors, Japan has just shifted demand back a quarter or two. If production slows now due to an availability of parts, it will make up the difference once the parts supply returns to normal.

As to Europe, if it were a real problem, we would see financial fear spiking again. To the contrary, as I pointed out last week, both the TED spread and LIBOR are comatose.

So the stop-and-go recovery comes back to a lack of a sustainable strong increase in consumer demand. Part of that is housing still being flat on its back, part of it is stagnating if not declining household wealth and near-deflation in wages. And how much consumers do have to spend in the productive economy depends very much on the wildly fluctuating price of Oil, which in turn is serving as a choke collar, cutting off the oxygen flow every time the recovery starts to run.

Dr. Copper Knows All

Last week, I posted on copper. Today we have a great chart from Dr. Ed on the relationship between copper prices and the stock market.


That chart is one of the reasons copper prices are so important.