With Oil near $110 a barrel and gasoline prices over $3.75 a gallon, it seems worthwhile to revisit a post I wrote almost exactly one year ago, examining Oil prices and the recovery.
There are two mavens of Oil prices that I turned to: Econbrowser's Prof. James Hamilton and Douglas-Westwood Oil analyst Steve Kopits. Both used similar metrics, but their conclusions differed considerably (click on the link above to read the entire discussion).
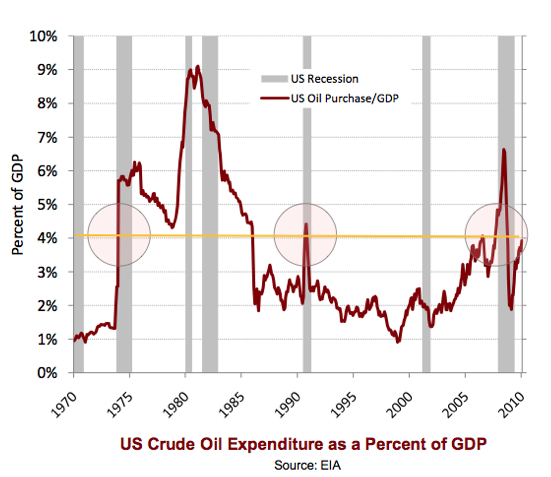
Kopits' point of view was straightforward: "In every case, when oil consumption in the US reached 4% percent of GDP, the U.S. went into recession." In 2010, Kopits pegged that price as $84 a barrel. Additionally, Kopits noted that all of those cases also coincided with a 50% increase in the price of Oil YoY, creating a "shock."
Hamilton espoused a similar point of view (price threshold plus shock) but applied different metrics, in particular that the price of Oil had to cross into uncharted higher territory:
One year later, we can see some further clarity. In both 2006 and 2010, Oil briefly crossed the threshold of 4% of GDP. In 2006 that coincided with one quarter of GDP growth of only 0.5%. In 2010 that quarter saw only 1.7% growth in GDP.
Last year, Oil very briefly touched $90 a barrel. For the last month, this year Oil has been over $100. In February of this year, Prof. Hamilton was still sanguine, observing Good news from auto sales -- for now. In particular he noted that "SUV sales are still far enough below even February 2008 values that it wouldn't represent the same size hit to GDP as we experienced in the spring of 2008 even if light truck sales were to decline from here back to the levels of June 2008."
Kopits, however, has been warning of another Oil shock in 2012, if not sooner. As of three weeks ago, he said:
The metrics:
First, here is Professor Hamilton's latest graph of Oil as a share of consumer purchasing, from February. Since then there has been a further substantial spike :

Next, here is Steve Kopits' graph of Oil price as a share of GDP, dating from 2010:
Here is an update of Kopits' metric, including GDP through 4Q 2010 and gas prices through last month (normed at 1.0 in 1990, when consumption barely exceeded 4% of GDP):
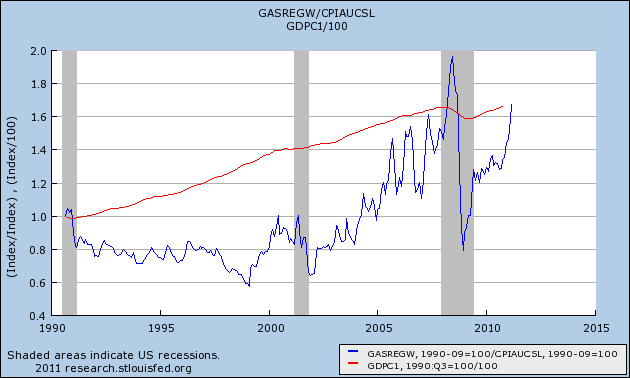
At this point it is clear that Oil consumption is more than 4% of GDP and also more than 6% of purchasing power.
But what about the "shock?" As this graph shows, a 40% sustained increase YoY was sufficient to coincide with a recession at the end of 2007. If Oil continues to trade at $110 a barrel into May, we will pass the 40% threshold again:
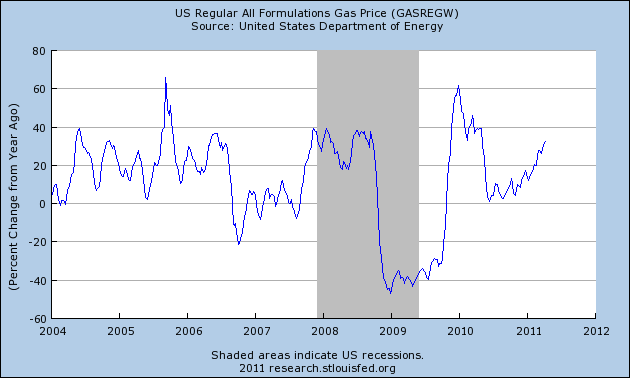
In short, we appear to be on the verge of satisfying the criteria from both models for an Oil shock induced recession. Only the fact that Oil has not made a new all time high appears to be missing.
The fallout:
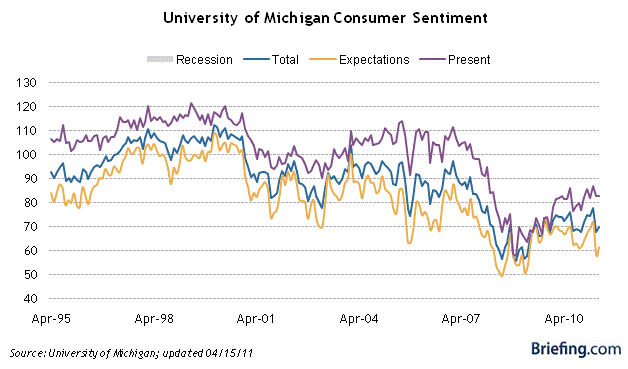
In February, Prof. Hamilton was optimistic. There had not been any "abrupt drops in consumer sentiment, postponement of purchases of consumer durables, and important changes in the kinds of vehicles consumers buy." The data since then is more ominous. [Note: in all the graphs that follow, gas prices are in blue]:
Consumer sentiment, which had been see-sawing in late 2010
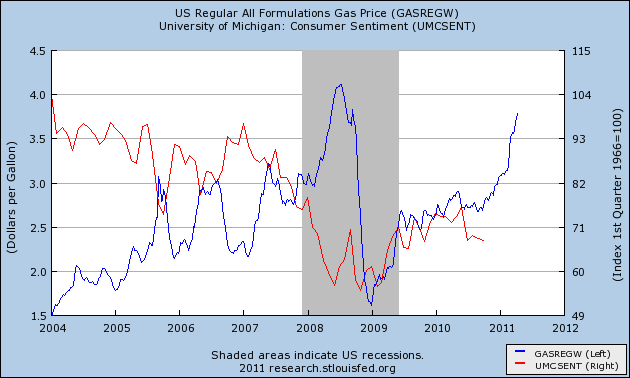
has once again cratered in the last several months:
New car sales declined slightly in March:
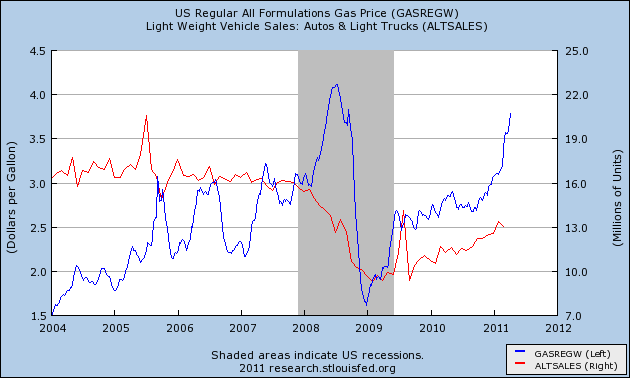
In response, Professor Hamilton observed that
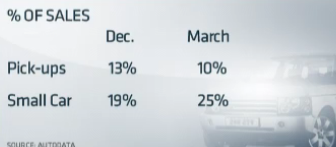
Truecar CEO Scott Painter said in the video that there had been a significant shift towards gas efficient cars and hybrids just in the last 30 days - similar to that last seen in April 2008.
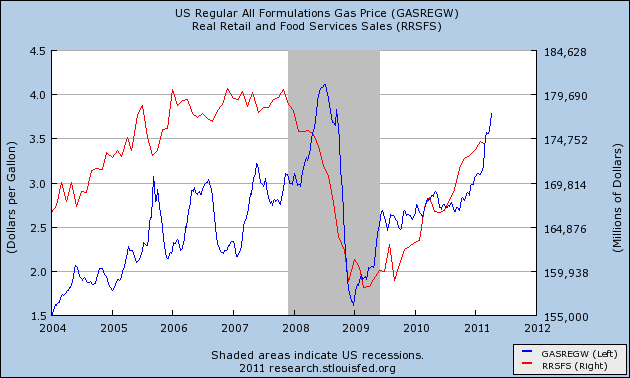
There are other signs of weakness as well. As I noted last Friday, real retail sales turned negative in March for the first time since last summer's slowdown:
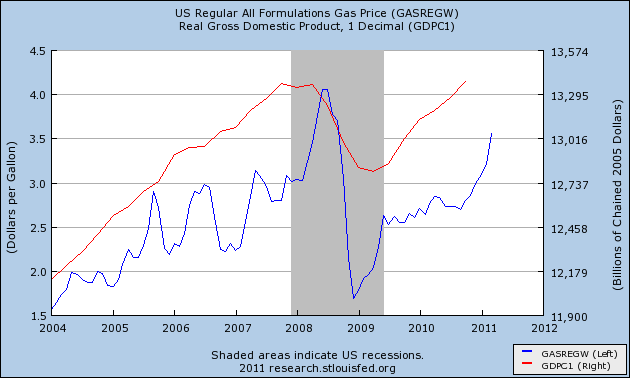
GDP, which had been expected to grow smartly, is now projected to have grown under 2% in the first quarter, similar to 3Q 2006 and 2Q 2010 - and that is before the most recent continuation of the spike:
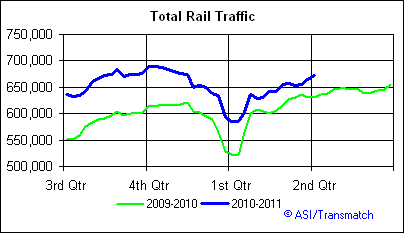
Rail traffic is still growing, but its relative YoY progess has stalled. In the graph below, the upturn in the last several weeks is exclusively due to intermodal containers used in imports and exports:
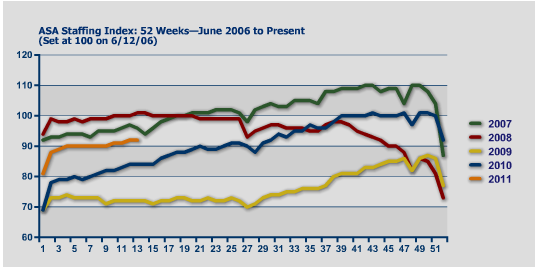
Temporary hiring, as measured by the American Staffing Association Index on a weekly basis, has also failed to continue its relative YoY improvement:
The Department of Energy's report of weekly gasoline consumption has also been negative YoY for the last 5 weeks.
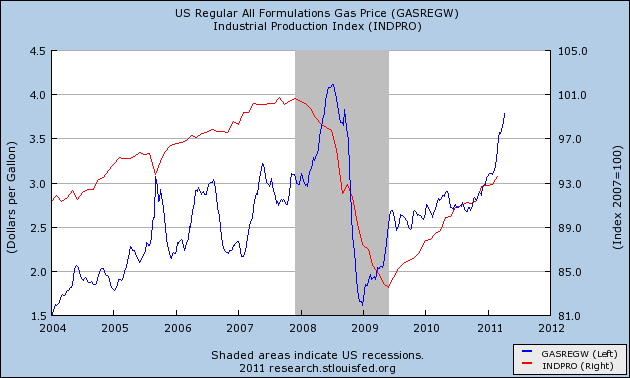
The story with Industrial production is more equivocal. It was up .8% in March, but for the last 3 months as a whole its increase has been tepid, but not in any definite way breaking trend from its recession bottom:
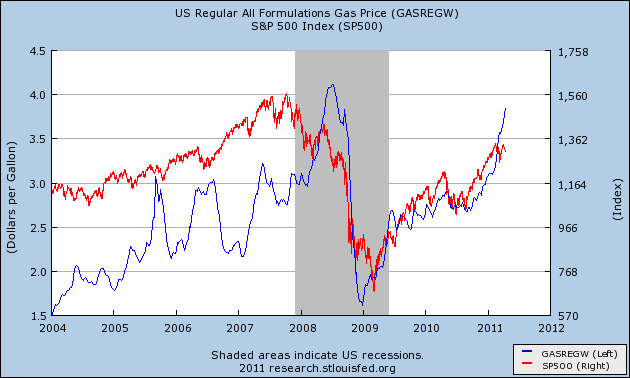
Finally, the S&P 500, which normally rises with the price of Oil in expansions, has also failed to make a new high in the last two months, mirroring its stalls of 2006, 2007, and May 2010:
Many of the statistics cited above have only turned down for one month, and one data point obviously does not make a trend. The point is, the data is behaving exactly like we would expect it to behave if we had reached a turning point in an Oil shock.
So, am I calling for renewed recession? Not at this time. While I expect the Leading Economic Indicators report on Friday to be "soft," with the strong housing permits data on Tuesday it will certainly be positive. Typically recessions do not begin until at least 8 of the 10 LEI are negative compared with 6 months previous, or the LEI are down 3 months in a row. Also Real M1 is growing at about 10%, and there has never been a recession going all the way back to the Great Depression with Real M1 positive. Further, Prof. Hamilton's point that many consumers have already made the adjustment to $3.75 gas - via for example their small car purchases several years ago - has a lot of merit.
But if Oil prices remain elevated for several more months, the LEI turning negative becomes more of a possibility. At very least, the Oil shock of 2011 has almost certainly begun, and it is likely already causing a substantial slowdown.
[T]here is a threshold effect before the next oil price shock would begin to do its damage. According to that relation, oil has to get back above $130 before it would matter again for GDP growth.... Another magnitude ... important to watch is the share of the budget of an average U.S. consumer that is devoted to energy purchases. This had fallen considerably in the 1990s, making it easier for many consumers to largely ignore modest energy price fluctuations. When this share rises above 6%, it seems to become a more significant factor.In Hamilton's analysis, Oil price increases first show up as increased spending, or decreased savings. But if the price continues to rise
[I]t is not just the level of consumer spending but also a sudden change in its composition that sometimes contributes to an economic recession. When oil price increases are sufficiently sudden and dramatic, we see abrupt drops in consumer sentiment, postponement of purchases of consumer durables, and important changes in the kinds of vehicles consumers buy.Spencer England of the Angry Bear blog also pointed to an interesting corollary: "If you do consumer spending on energy as a share of consumer spending plus spending on autos you get a very stable ratio. This suggest one of the biggest ways consumers adjust to higher oil prices is to delay buying a new auto."
One year later, we can see some further clarity. In both 2006 and 2010, Oil briefly crossed the threshold of 4% of GDP. In 2006 that coincided with one quarter of GDP growth of only 0.5%. In 2010 that quarter saw only 1.7% growth in GDP.
Last year, Oil very briefly touched $90 a barrel. For the last month, this year Oil has been over $100. In February of this year, Prof. Hamilton was still sanguine, observing Good news from auto sales -- for now. In particular he noted that "SUV sales are still far enough below even February 2008 values that it wouldn't represent the same size hit to GDP as we experienced in the spring of 2008 even if light truck sales were to decline from here back to the levels of June 2008."
Kopits, however, has been warning of another Oil shock in 2012, if not sooner. As of three weeks ago, he said:
Right now, the 4% limit is about $88 / barrel crude. Brent's at $115. On paper, this should be enough to put us into recession. On the other hand, the recovery is providing momentum the other way. So, as [Prof. Hamilton] points out, the oil price is a drag, rather than a killer right now.So, is a slowdown or even a recession baked in the cake? With the spike in Oil prices from $90 a barrel to $110 a barrel in the last two months, is Hamilton's optimism still warranted? Let's look at the data.
The metrics:
First, here is Professor Hamilton's latest graph of Oil as a share of consumer purchasing, from February. Since then there has been a further substantial spike :

Next, here is Steve Kopits' graph of Oil price as a share of GDP, dating from 2010:

Here is an update of Kopits' metric, including GDP through 4Q 2010 and gas prices through last month (normed at 1.0 in 1990, when consumption barely exceeded 4% of GDP):

At this point it is clear that Oil consumption is more than 4% of GDP and also more than 6% of purchasing power.
But what about the "shock?" As this graph shows, a 40% sustained increase YoY was sufficient to coincide with a recession at the end of 2007. If Oil continues to trade at $110 a barrel into May, we will pass the 40% threshold again:

In short, we appear to be on the verge of satisfying the criteria from both models for an Oil shock induced recession. Only the fact that Oil has not made a new all time high appears to be missing.
The fallout:
In February, Prof. Hamilton was optimistic. There had not been any "abrupt drops in consumer sentiment, postponement of purchases of consumer durables, and important changes in the kinds of vehicles consumers buy." The data since then is more ominous. [Note: in all the graphs that follow, gas prices are in blue]:
Consumer sentiment, which had been see-sawing in late 2010

has once again cratered in the last several months:

New car sales declined slightly in March:

In response, Professor Hamilton observed that
One worry is that gasoline prices are now about the level we saw at the end of April 2008. Interestingly, March 2011 light vehicle sales are also about the same levels as in April 2008. The big difference is, in April of 2008 we were describing those levels as a 14% drop from April of 2006. Now the car manufacturers count themselves lucky to be doing even that well.His worry is borne out by this graphic from a recent CNBC video which shows that in the last few months customers have swung back from buying light trucks to gas-sipping hybrids and compacts:

Truecar CEO Scott Painter said in the video that there had been a significant shift towards gas efficient cars and hybrids just in the last 30 days - similar to that last seen in April 2008.
There are other signs of weakness as well. As I noted last Friday, real retail sales turned negative in March for the first time since last summer's slowdown:

GDP, which had been expected to grow smartly, is now projected to have grown under 2% in the first quarter, similar to 3Q 2006 and 2Q 2010 - and that is before the most recent continuation of the spike:

Rail traffic is still growing, but its relative YoY progess has stalled. In the graph below, the upturn in the last several weeks is exclusively due to intermodal containers used in imports and exports:

Temporary hiring, as measured by the American Staffing Association Index on a weekly basis, has also failed to continue its relative YoY improvement:

The Department of Energy's report of weekly gasoline consumption has also been negative YoY for the last 5 weeks.
The story with Industrial production is more equivocal. It was up .8% in March, but for the last 3 months as a whole its increase has been tepid, but not in any definite way breaking trend from its recession bottom:

Finally, the S&P 500, which normally rises with the price of Oil in expansions, has also failed to make a new high in the last two months, mirroring its stalls of 2006, 2007, and May 2010:

Many of the statistics cited above have only turned down for one month, and one data point obviously does not make a trend. The point is, the data is behaving exactly like we would expect it to behave if we had reached a turning point in an Oil shock.
So, am I calling for renewed recession? Not at this time. While I expect the Leading Economic Indicators report on Friday to be "soft," with the strong housing permits data on Tuesday it will certainly be positive. Typically recessions do not begin until at least 8 of the 10 LEI are negative compared with 6 months previous, or the LEI are down 3 months in a row. Also Real M1 is growing at about 10%, and there has never been a recession going all the way back to the Great Depression with Real M1 positive. Further, Prof. Hamilton's point that many consumers have already made the adjustment to $3.75 gas - via for example their small car purchases several years ago - has a lot of merit.
But if Oil prices remain elevated for several more months, the LEI turning negative becomes more of a possibility. At very least, the Oil shock of 2011 has almost certainly begun, and it is likely already causing a substantial slowdown.