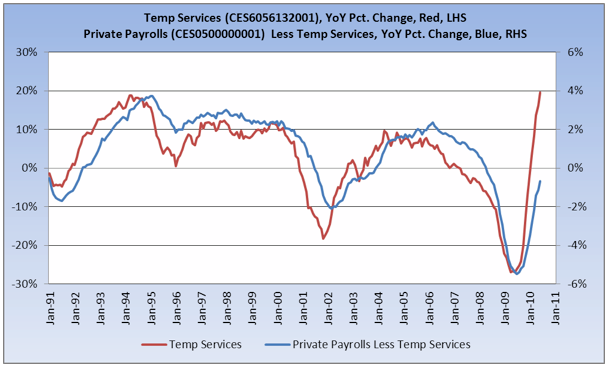
About a week ago, our occasional co-blogger Invictus, who now typically hangs out at the more spacious digs of Barry Ritholtz' the Big Picture (and more power to him), posted about the divergence between temporary help and nonfarm payrolls, wondering if the unique difference in this recession/recovery was "as good as it gets."
I do think that this is a case were "it's different this time", but only in that the relationship between the two series is not as simple as initially appears. In fact, I believe the divergence is explained well by this graph from the American Staffing Association that I posted several weeks ago:
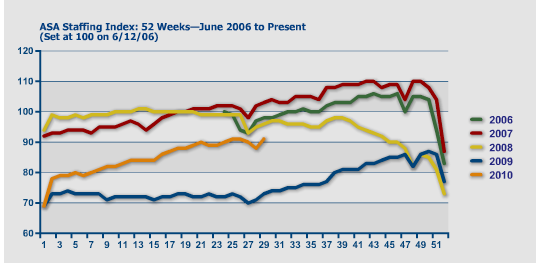
It's not just that the hiring of temporary help is a precursor to the hiring of permanent jobs. Each temporary job can also be seen as an *alternative* to establishing a permanent position. In the 2008-09 downturn, temporary services, like all other jobs, were hit hard. The graph by the American Staffing Association suggests that employers are first re-filling their needs by temporary positions before making the riskier commitment of a permanent position.
Note that in 2001 there was a steeper decline in temp help than in 1991, and similarly a deeper decline in 2009 than in 2001. The relationship between the two series thus can be explained as "the deeper the loss in temp services, the longer the lag." As there were a lot of temporary positions to re-fill, and they have not already been filled, it makes sense that the robust pattern seen in the temporary index would not yet be seen in the nonfarm payrolls number.
Note also that there was a temporary downturn for several weeks in the Association's index, which also showed up in the nonfarm payrolls number. This past week, for the third week straight, the Association's index increased again taking the index higher than shown above, to 94.
Note also that there was a temporary downturn for several weeks in the Association's index, which also showed up in the nonfarm payrolls number. This past week, for the third week straight, the Association's index increased again taking the index higher than shown above, to 94.