Friday, August 13, 2010

Does anyone think these people filed for unemployment benefits?

- by New Deal democrat

Yesterday and today, I've been addressing the conundrum that virtually every measure typically used to measure employment (temporary hires, tax withholding) suggests we ought to be having much stronger payroll gains than we have had this year. Over at The Big Picture, our sometimes-coblogger Invictus has noted the same with regard to the ISM manufacturing index and durable goods orders as well in the last few weeks. This post adds to that picture.

One question, asked with renewed urgency after yesterday, is where are all the weekly new jobless claims coming from? They aren't broken down by industry or service, so we have been left to guess. There may have been a distortion to the good side in July from auto workers not being laid off by GM. There almost certainly has been some effect to the down side of Census workers filing (eligibility varies from state to state, and as this post excellently argues, it may pay some of the workers to wait several months first -- if they can survive).

But with several months of initial jobless claims increases to look at, and several subsequent nonfarm payrolls reports, let's take a look at this convenient breakdown via briefing.com:


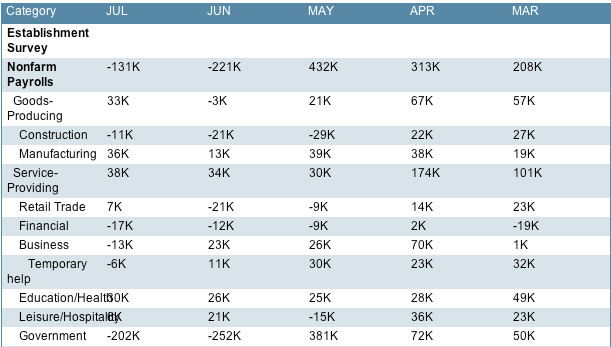
Notice the virtually ALL of the decrease in employment for the last few months has come from 3 sources: (1) government workers, including census workers (about 368,000 laid off) and also state and local employees (another 86,000). This has been 80%-90% of the downdraft. The remaining part is split between (2) construction (-32,000), and (3) finance (-29,000) -- but the finance layoffs haven't been in Wall Street finance, a closer look at the BLS breakout reveals about 1/3 of them to have been in real estate finance.

In other words, almost all of the non-census downdraft in payrolls has been from the two stimulus programs that ended in April-June: the $8000 home buying credit, and aid to the states. Do you suppose most of those people applied for jobless benefits? If so, that easily explains almost the entire stalling and upturn in those numbers.

Put another way, part of the downturn in employment that would have normally taken place a year ago, making 2009 even worse, is instead taking place now. If so, all else being equal, it is more likely to be the tail end of the job loss hurricane, rather than the onset of a new one.

While collectively my posts yesterday and today explain where the biggest weaknesses are located, and part of the reason why, there is a decisive aspect of the sudden slowdown since April that needs to be addressed, and is not going to be addressed by the economics profession. With that tantalizing clue, more (hopefully) Monday.

4 comments:

Anonymous said...

A lot of the economic upturn in the early spring of this year was due to the big increase in spending from tax refund checks. The Goldman chain store sales numbers went from being near recession lows in January and February to increasing massively to new post-January 2009 highs at the exact same time the stimulus checks began coming out. Another reason for the upturn was from, like you said, the flurry of new residential construction activity resulting from the first time home buyers tax credit. Virtually every homebuilder also built many spec-homes. I live in a Toll Brothers community and they built a spec home three lots down from me, as well one in every one of their communities nationwide at the Executive and Carolina levels. The spec home building should be over for every home-builder now.

bonddad said...

Anonymous -

Once again you have attempted to argue the ISM number is skewed by "survivor bias" without offering any attribution too that theory. Again -- if you have proof (actual data demonstrating the ISM data is incorrect) -- please provide a link or reprint the data.

bonddad said...

Anonymous -

The drop in manufacturing employment that you cite was also accompanied by an increase in industrial output and increase in productivity which explains the decrease in employment yet increase in output.

Do you have information from the ISM that their research methods are in any way tainted? For example, can you site a paper by someone with a PHD in economics or statistics that explains problems in the ISM methodology? Try going to SSRN.com to find one. Until then, it is mere conjecture from an anonymous poster on the internet.

bonddad said...

Anonymous -

I have asked you twice to present evidence -- not your opinion -- regarding the flawed methodology of government statistics. I suggested you might want to link to a paper written by academics in the statistics or economics field from the SSRN network -- or some other source which corroborates your claim. You have not done so.

You are simply an anonymous poster on a blog who is presenting an unverified opinion -- nothing more. Until you present credible, third part evidence, your theories will not be posted. You can always start your own blog.

The internet is full of such conspiracy theories, none of which are verified, all of which are garbage and refutable by a simple reading to the statistical methodology, and all of which pollute the debate so as to make rational discussion meaningless.

In addition, the issue you speak of -- the issue of accounting for imports in GDP calculations -- was highlighted in a NY Times article which concluded the most this distortions would subtract from GDP is .2%. See here:
http://www.nytimes.com/2009/11/09/business/economy/09econ.html?_r=1&ref=business

If you have third party evidence, please present it. If not, please don't waste my time.