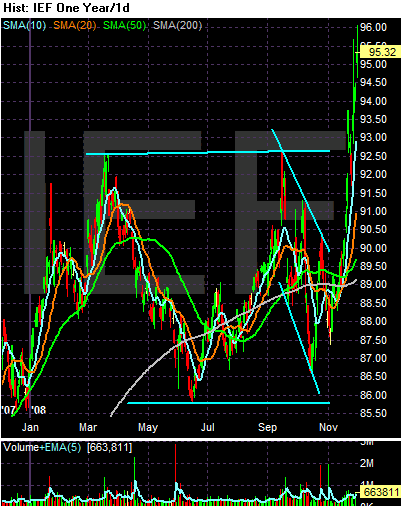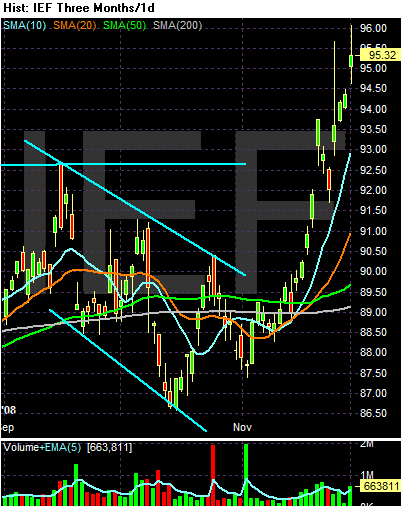
Prices have spiked above the upper trend lined of a year-long consolidation pattern. This indicates the credit crunch is still very much alive as traders seek-out investments that provide for a return of capital rather than a return on capital. While the interest rate on the 10 year is prohibitively low right now (2.72%) traders are still piling into the Treasury market.

Notice the following on the three month chart:
-- Prices have clearly moved above the upper trend line of the year-long consolidation pattern
-- Prices are above all the SMAs
-- The 10, 20 and 50 day SMAs are all moving higher
-- The shorter SMAs are above the longer SMAs
Bottom line: In general, this is a very bullish chart. With the interest rate on the 10 year so low I am concerned prices can't move higher. However, we are in extraordinary times right now.