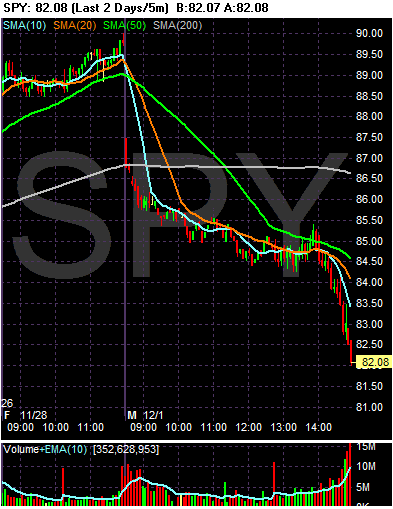
Notice the following on the daily chart:
-- Prices opened lower and then continued to drop
-- The 84.50 level offered a ton of support to prices
-- Once prices moved through the 84.50 level in a convincing fashion they tumbled on heavy volume
-- Prices closed at the absolue low on extremely heavy volume

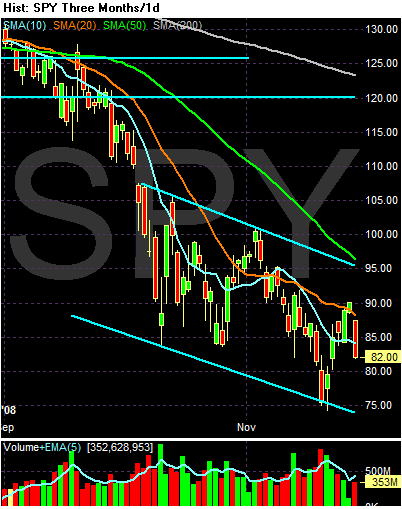
Notice the following on the daily chart:
-- All the SMAs are moving lower
-- The shorter SMAs are below the longer SMAs
-- Prices are now below all the SMAs
BUT
-- Prices are still within the downward sloping price channel
Bottom line: it's a damn ugly market right now.