Click for a larger image
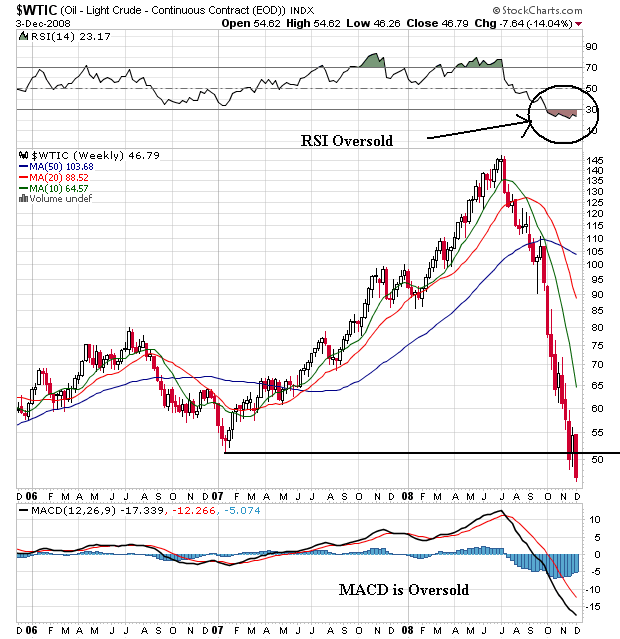
Notice the following on the weekly chart:
-- Prices are at their lowest point in three years
-- Prices have dropped 67% from their high five months ago
-- All the SMAs are moving lower
-- The shorter SMAs are below the longer SMAs
-- Prices are below all the SMAs
BUT
-- The RSI is very oversold
-- The MACD is oversold

Click for a larger image
Notice the following on the daily chart
-- Prices have been dropping for the last 5 months
-- All the SMAs are moving lower
-- The shorter SMAs are below the longer SMAs
-- Prices are below all the SMAs
BUT:
-- The MACD has been rising for about a month
Bottom line: There are technical indicators that say the market should rally. Like all indicators these should be read against the fundamental background of everybody selling their contracts and demand dropping.