The weekly charts look, well, terrible. There is nothing bullish in them at all.
Here's a 5-day, 5 minute chart of the SPYs.
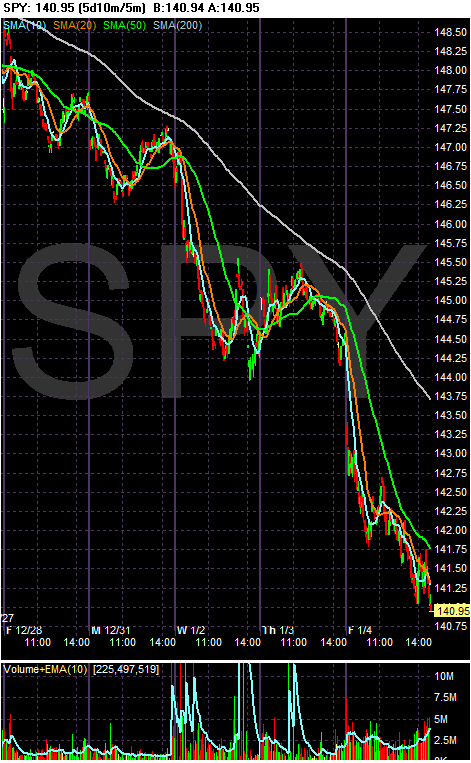
That's a straight shot down with nothing indicating a reason to move higher.
The markets moved lower from Friday to Wednesday. On Thursday they tried to rally but couldn't maintain their momentum. On Friday (thanks to a pitiful jobs report), the market sank big time.
Let's take out the moving averages and add some additional analysis.
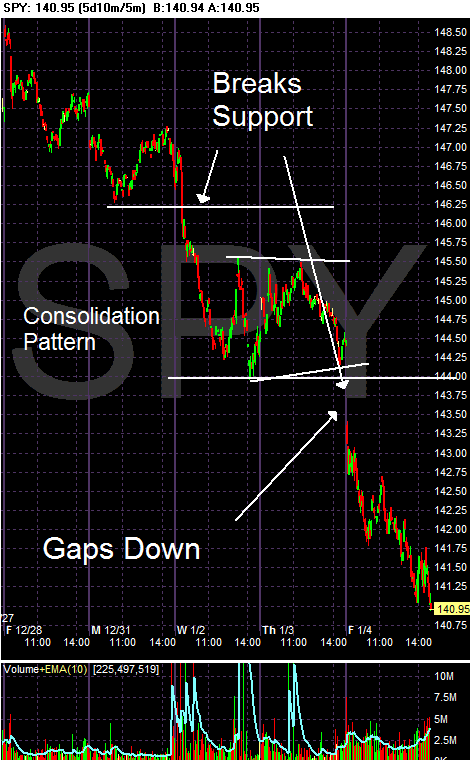
Note the following:
-- From Friday to Thursday the market is in a clear pattern of lower lows and lower highs.
-- I highlighted two areas where the markets broke clear support. However, there are others as well.
-- The market consolidated from mid-Wednesday to the end of Thursday. The market tried to rally on Thursday and couldn't hold its momentum.
-- Note the heavy selling volume at the close on Friday.
Short version: this is a bear market chart, plain and simple.
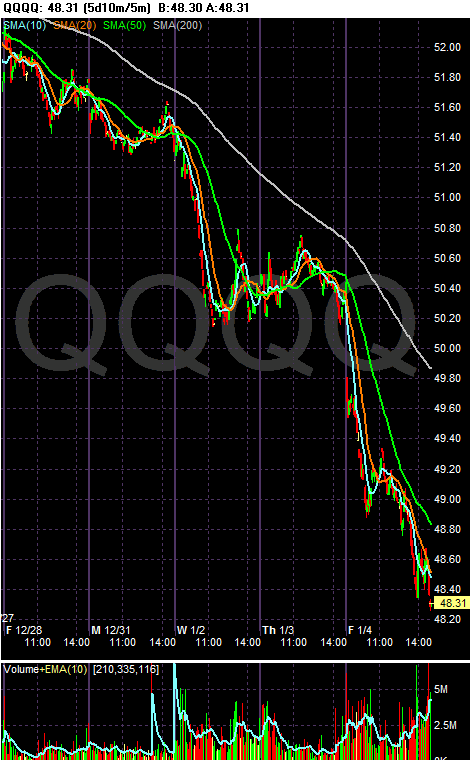
The 5-day, 5 minute QQQQ chart with the moving averages is as bad as the SPYs chart. This is literally a straight shot down.
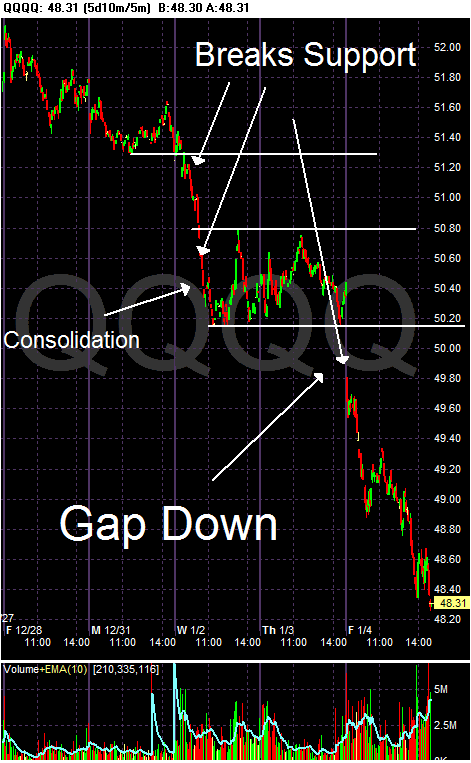
When we take out the moving averages and add in some trend lines, we notice the following:
-- A clear pattern of lower lows and lower highs.
-- An consolidation on Wednesday and Thursday.
-- a big gap down on Friday followed by a tumble down in a big way. Also note the heavy selling volume at the close of trading on Friday.
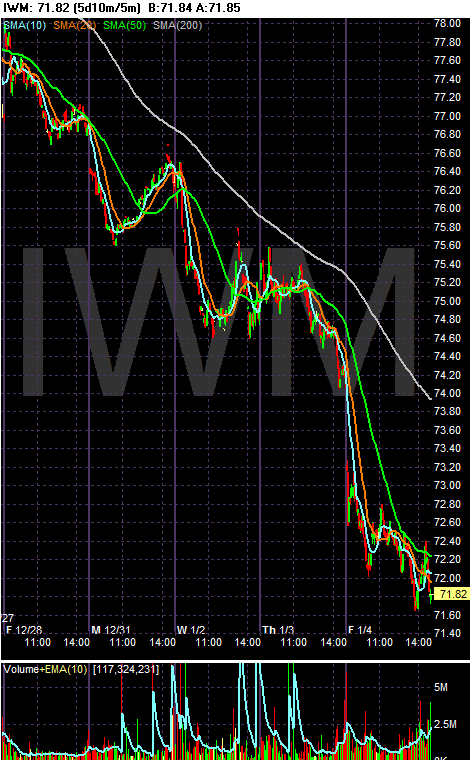
We see the same pattern with the IWMs that we do with the SPYs and QQQQs -- a straight shot down; no waiting.
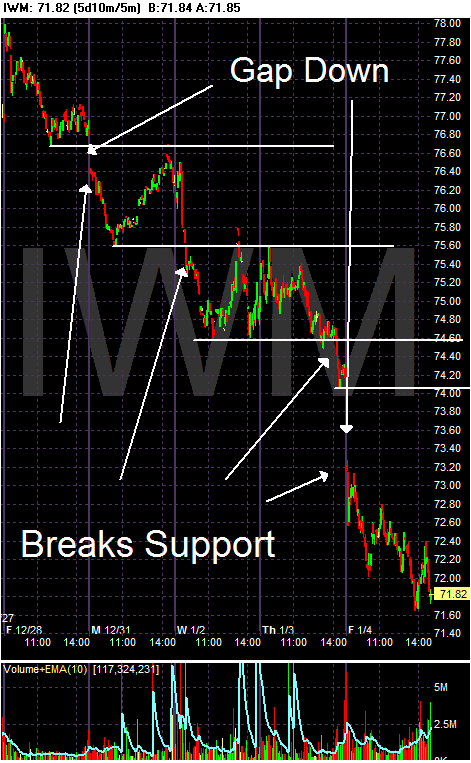
Note the following:
-- A clear pattern of lower lows and lower highs.
-- Numerous breaking of support levels.
-- Several gaps down
Here's the short version: this charts say sell me in a big way.