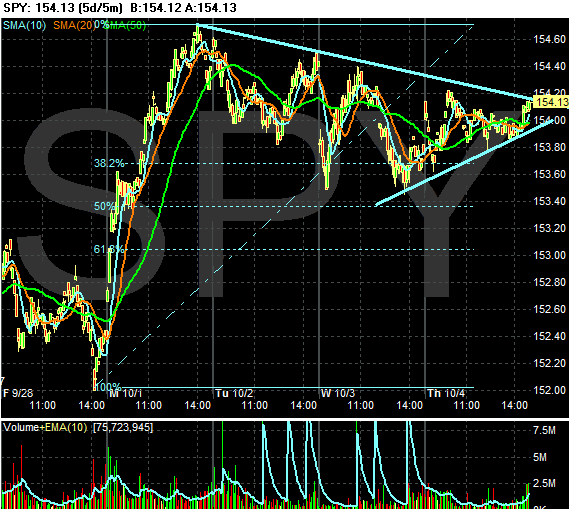
There are a couple of other interesting charts from the market that I think deserve some attention.
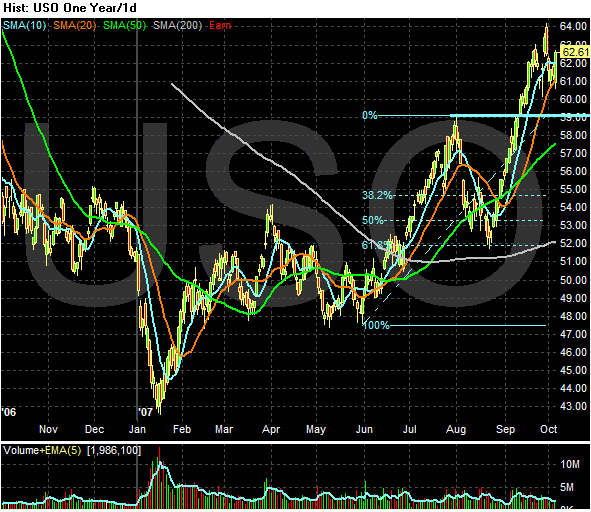
This is a year long chart of the oil ETF (USO). Notice the market rallied from June to August, then sold-off to the 61.8% Fibonacci level. The August sell-off was the combination of simple profit taking and and end of the summer blow-off.
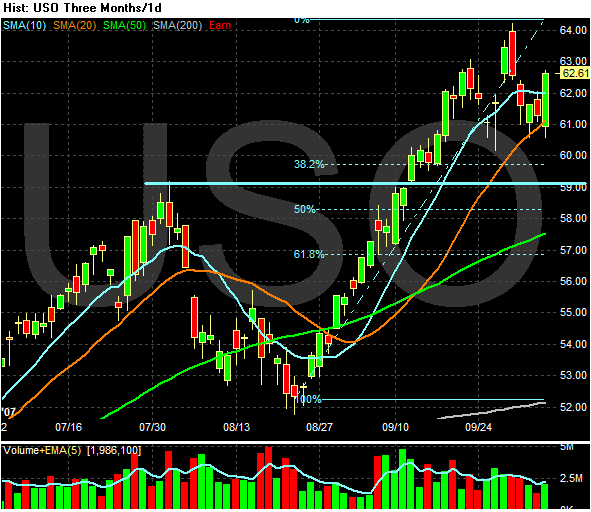
But since market "bottomed" in mid-September we've had a nice run. I included the Fibonacci levels for possible price targeting on the downside.
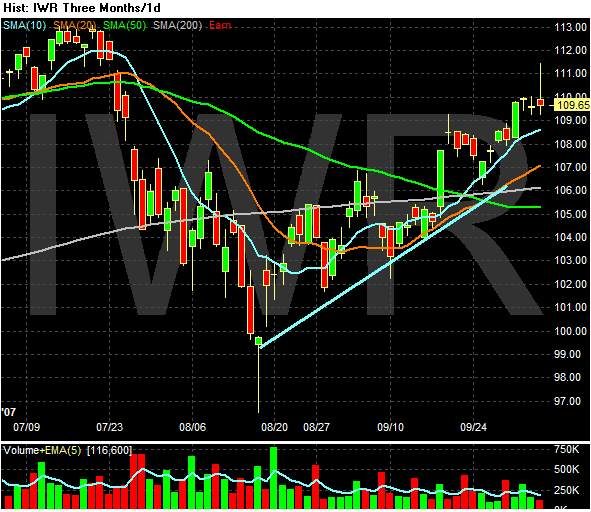
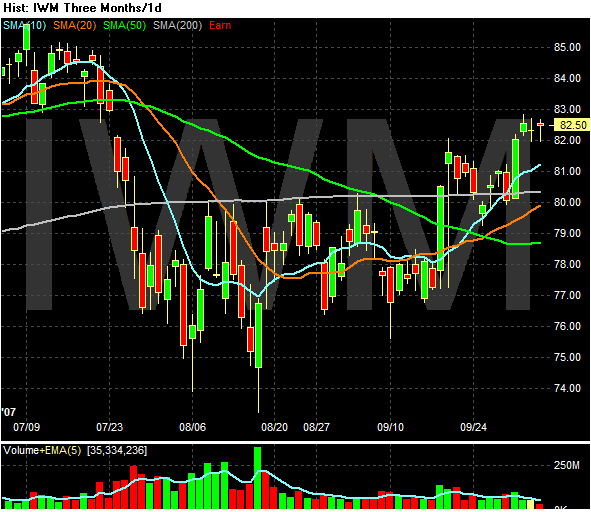
The mid-caps (IWR) and small caps (IWM) have the exact same trading pattern as the SPYs. Both of the above averages are cautiously moving up. They've had strong ups days followed by meandering action towards a moving average. These are not the strongest types of up moves we could expect.
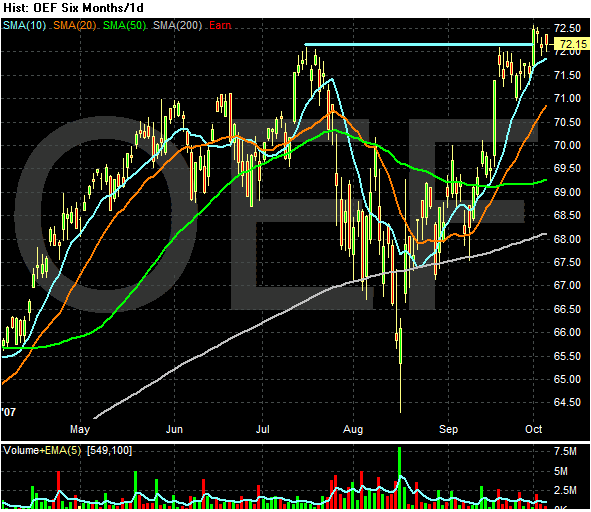
If the employment report is positive, this is where the action will be tomorrow -- the large caps. They are already outperforming the mid and small caps. In addition, they are resting near highs just waiting for some reason to move higher.