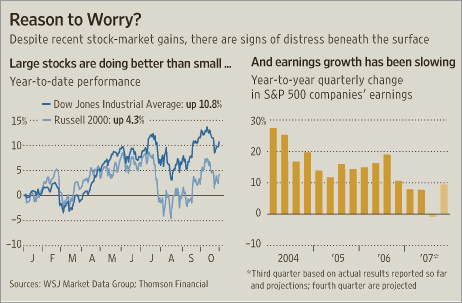
After the Fed's half-percentage-point interest-rate cut six weeks ago, major stock indexes rebounded, and the Dow Jones Industrial Average remains near its record high. But rising oil prices, mixed corporate profit reports and the spreading effects of a housing slump continue to fuel tumult in the economy -- and some underlying patterns suggest that stocks may have trouble maintaining their high-wire act.
The S&P 100 bounced off its 50 day SMA on Friday printing a strong upward bar. The index also rose above the 10 day SMA. The 20 day SMA is currently offering upside resistance. While the moving average picture could be a lot stronger, the shorter SMAs are above the 200 SMA which is a positive sign. The 10 day SMA is below the 20 day SMA (which is bearish), but the move could be temporary as the 10 is barely below the 20 SMA.
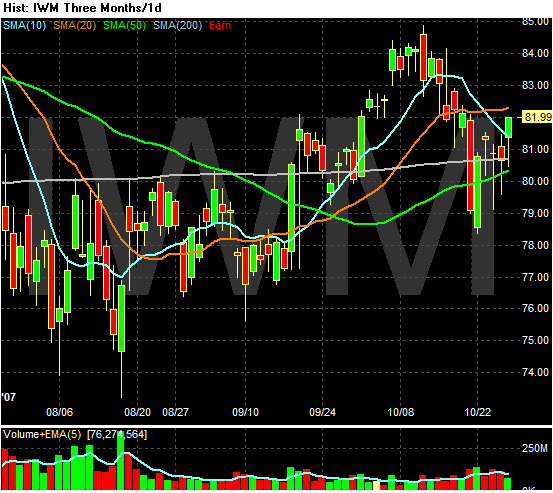
The Russell 2000 is trading around the 200 day SMA. In other words, this index is flirting with bear market territory. In addition, the Russell tried to break-out of this trading pattern in early October but couldn't hold above that technically important line. The moving averages are all bunched up offering no clear cut direction. In short, this part of the market looks fair at best.
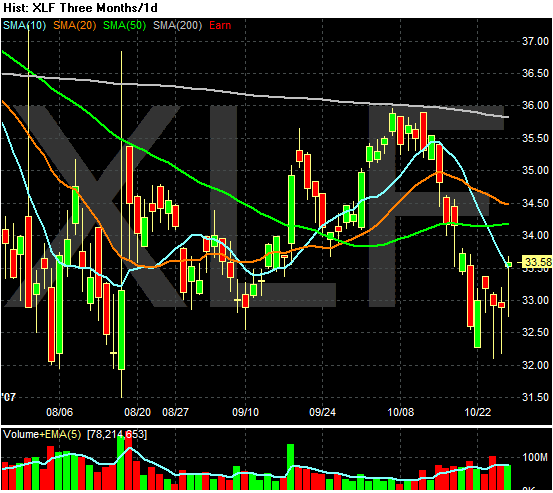
Financials are in terrible shape. They have been below the 200 day SMA for the last three months -- ever since the summer sell-off. Prices are completely below all SMAs -- a very bearish signal. These are important observations because financials compose about 20% of the S&P 500.
This split nature of the market is concerning. It indicates the market is rallying on the backs of a small swath of stocks and sectors. That means the strength of the rally is questionable.
The article linked to above also has a nice chart that shows earnings growth hasn't been there this quarter.