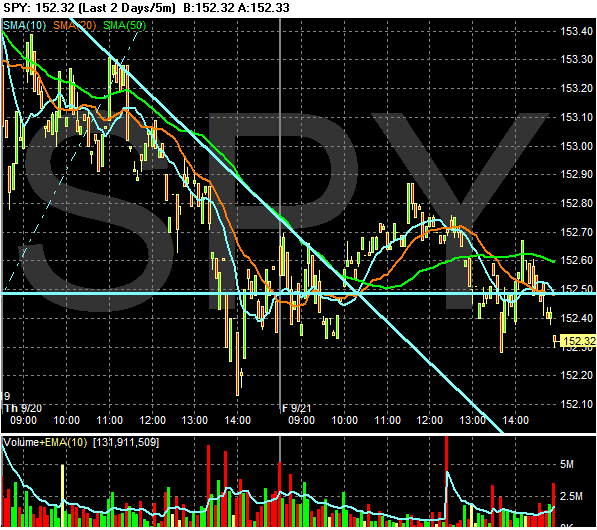
The two day chart shows the inaction. Basically, we closed where we started.
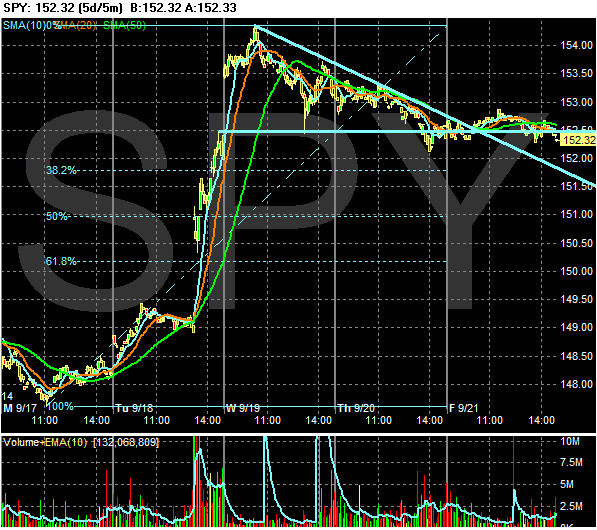
The 5-day chart shows the market broke the two day downtrend, but that was about it. It traded along Tuesday's closing price.
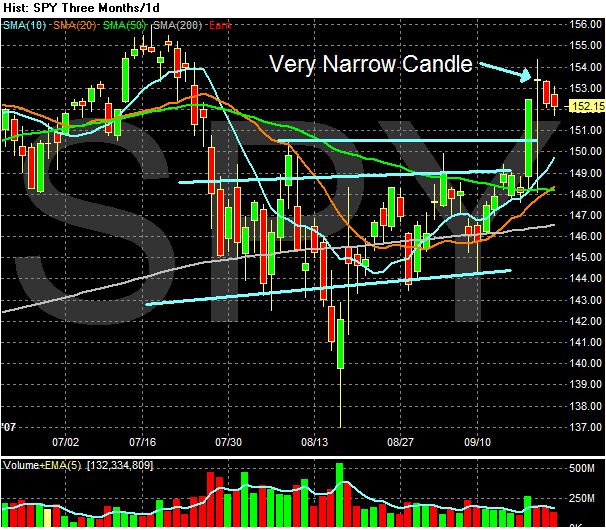
The daily chart shows the same thing. Notice how far above the 10 day SMA the close is. Prices don't usually move above a moving average for a lengthy amount of time; moving averages are a lot like a center of gravity for prices. Expect the market to continue to move towards the moving average next week.
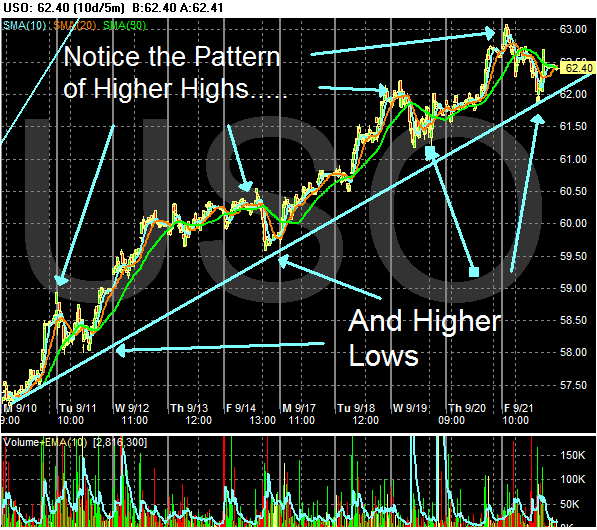
Here is the oil market represented by the USO ETF. Notice the pattern of higher highs and higher lows along an uptrend. This is what a strong market looks like. Oil traders are betting low rates will increase oil and gas demand.
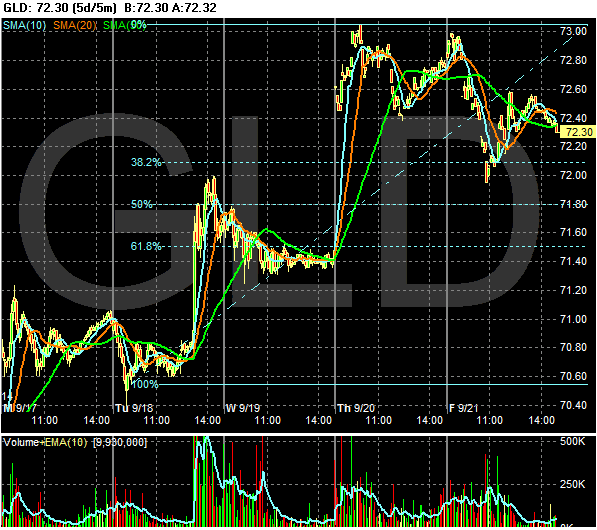
The 5-day chart of gold shows a technical sell-off, as traders sold the gold ETF to the 38.2% Fibonacci level. This looks like simple profit taking to me.
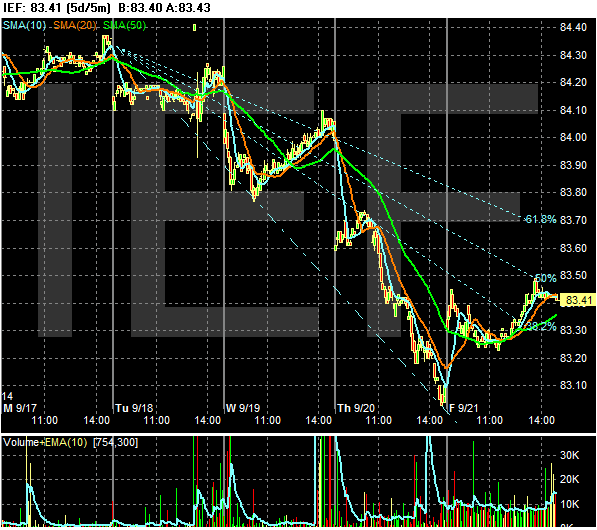
The medium term Treasury market rose today. Traders are now betting on slower growth. However, note the market rallied to a 50% Fibonacci fan. This could mean the rally is short-lived as traders start to sell again next week.