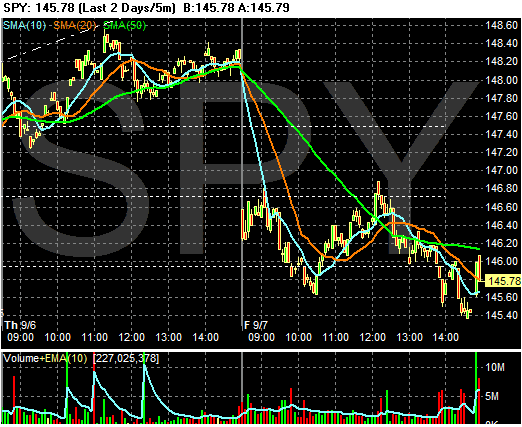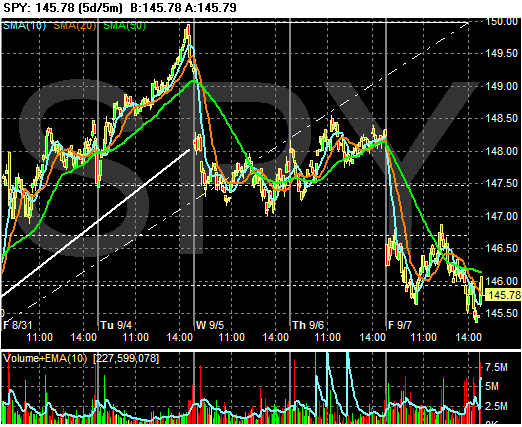
Here's a 5-day chart. The market broke trend on Wednesday, traded in a range for two days waiting for the employment report, then sold-off today.

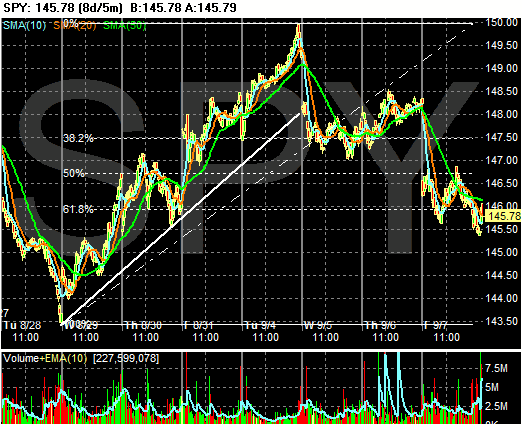
Here's an 8-day chart. Notice that even though the market has broken the uptrend and sold-off, we're now at the 61.8% Fibonacci retracement level from the rally.

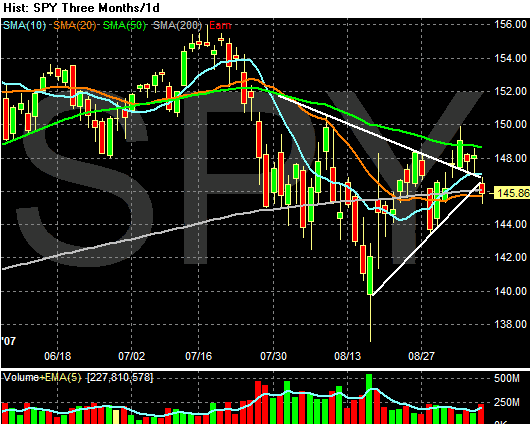
Here's the daily chart. Notice the following:
1.) The SPYs have broken the neck line of the head and shoulders formation.
2.) The SPYs are back at the 200 day SMA.
3.) The SPYs broke the uptrend stared in mid-August.
