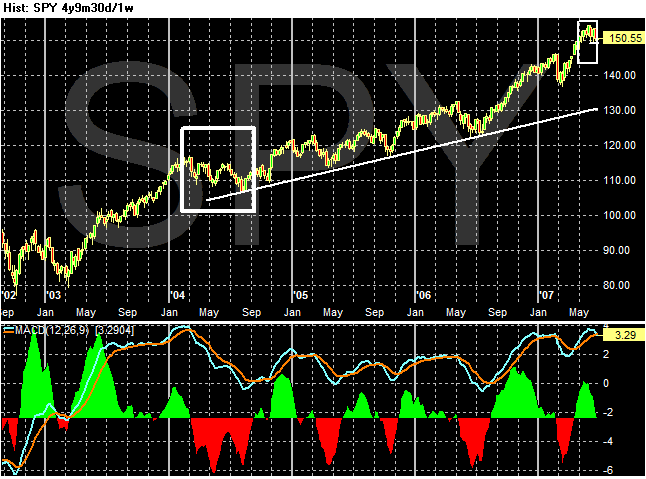
Here is a 5-year chart of the SPYs, this time using a weekly chart and the MACD. Notice the last time the MACD was at this level was after an impressive gain -- the index ran from about 82 to 115 over a 12 month period, or an overall gain of 40.24%. After that run, the index consolidated for six months.
This time, the index rose from 125 to 150, or an increase of 20% over 12 months.

