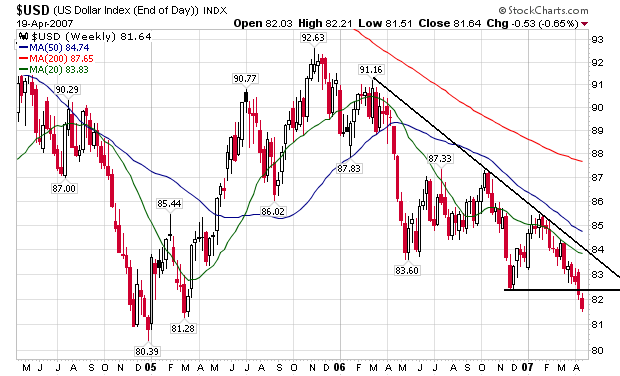
Notice the following.
1.) The dollar has broken through support and is now trying to find a new low.
2.) The downtrend started in early 2006 is still intact.
3.) The 20, 50 and 200 day SMAs are all heading lower.
In short, there is not one bullish element on this chart.
The underlying fundamentals are still bearish. The US economy is slowing while other economies are growing. While the trade deficit has decreased over the last few months, it is still at very high levels.