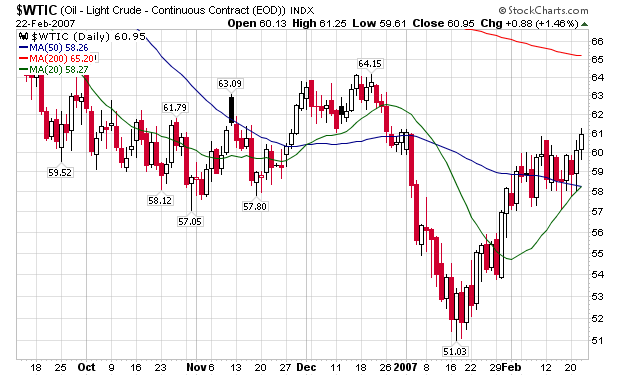
Looking at the raw data, here's what we have. Starting in mid-January, oil rose from it's lows and ran into resistance at the 50 day simple moving average. For about the next month, traders consolidated these gains. Yesterday, oil closed over the psychologically important level of $60/bbl. In addition, it appears the 20 day simple moving average is about to cross the 50 day average. The price is trading above the 20 and 50 SMA. Finally, the uptrend is still firmly in place. In short, there are a lot of strong technical reasons for this chart to continue moving up.
There were a few fundamental reasons for yesterday's move. The first is geopolitical, as the Iran/US clash is still ongoing and internal strife in Niger threatens oil production. In addition, the Department of Energy reported a decrease in oil stocks for the week. We are also approaching the summer driving season when demand should pick-up. And China and India are still growing at a high clip, adding further upward pressure to prices.
In short, the bulls have a lot to be happy about right now.
The next bullish move would be a retesting of the $60 line in a short sell-off.