Here's the QQQQ's
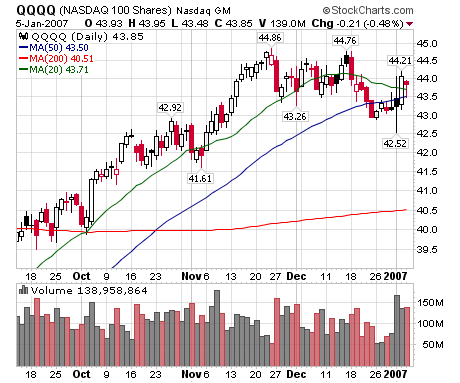
This chart looks a little better than it did last week. We had a strong bar on Thursday and the market closed above $43.26 on Friday of decent volume. The 3-day upward/downward volume ratio is in an upswing, but the New high/new low ratio didn't move upwards. The lack of confirmation of new highs/lows makes the rally slightly suspect and lends credence to the argument this upward move is a continuation of the reaction rally started in late December.
Here's the SPY:
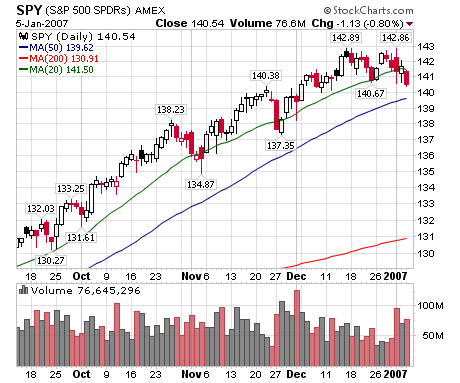
On Friday, the market closed below the support line at $140.67, but only slightly over. A standard rule of thumb from Gann is the market must move at least a point over support or resistance to be a change of trend. However, the downward rend is pretty strong with two solid bars and big volume. Finally, we have still have the possibility of a double top forming. While not the strongest formation on record, it is there.
Here's the Russell 2000
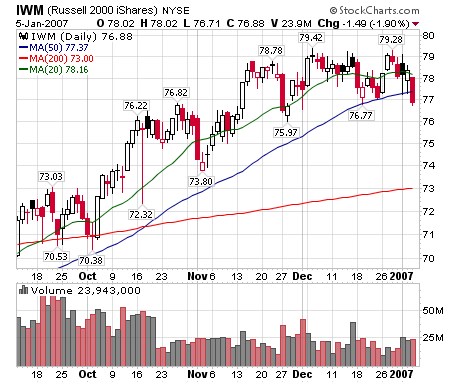
Like the SPY's, the IWM's closed below support at $76.77, but only slightly over the line. But Friday's bar was a solid downward move on solid volume. We still have the possibility of a head and shoulders topping formation, with the right shoulder almost completed.
Finally, the 3-day NYSE Up/Down volume ratio was down for the week, while the New High/New Low line has been decreasing slightly since mid-December.